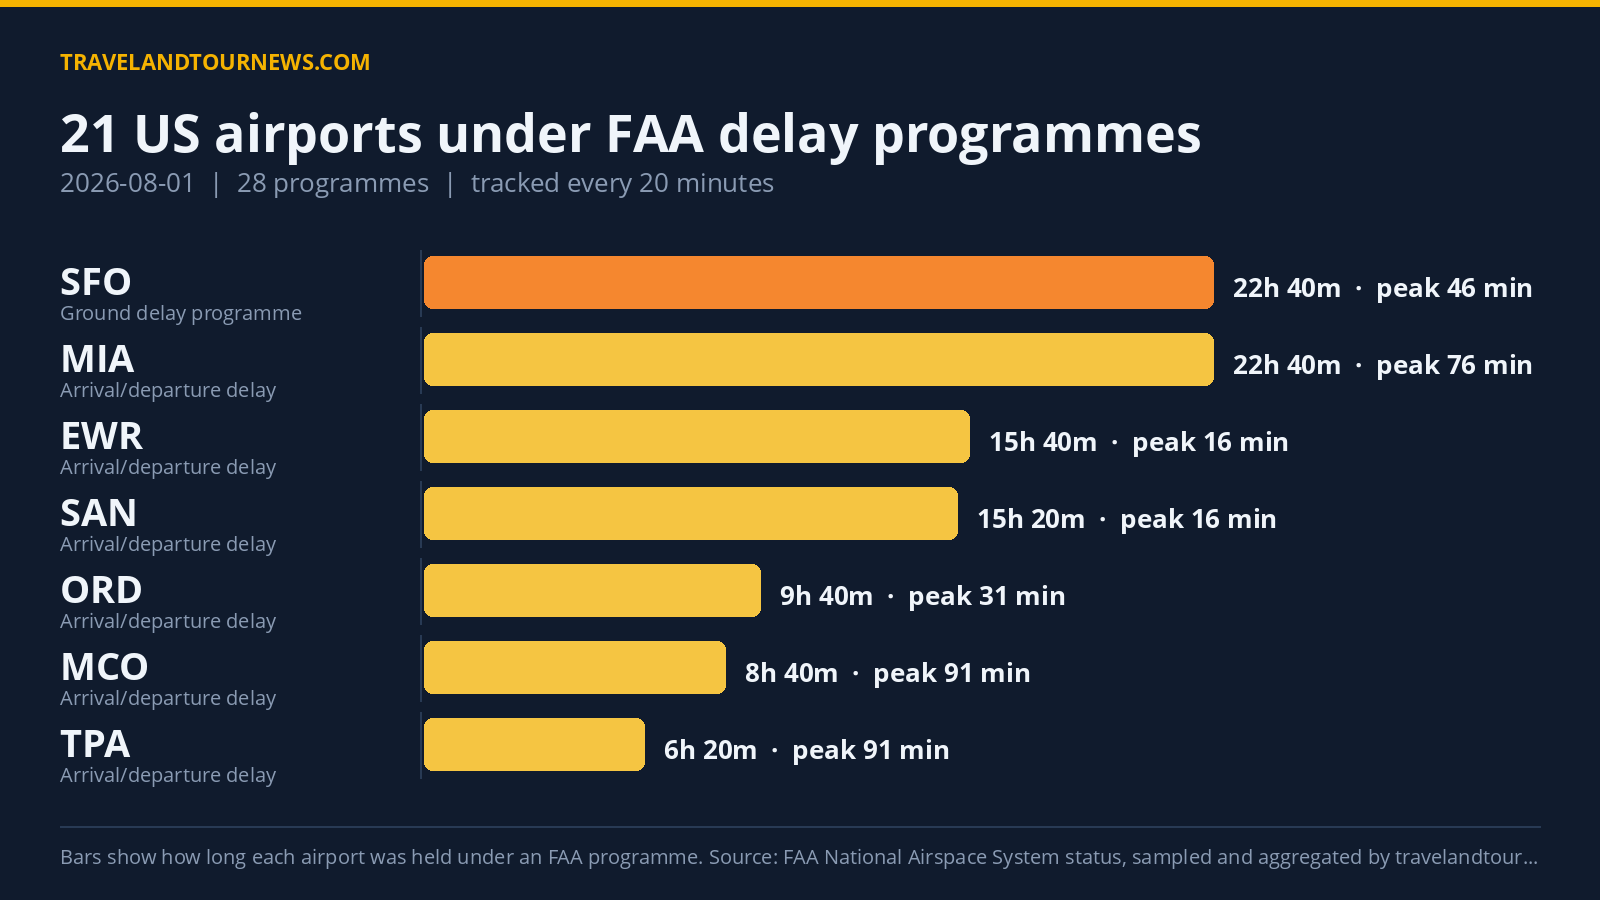

On August 1, 2026, the FAA imposed delay programmes at 21 US airports with a total of 28 programmes, the most significant impact recorded at Orlando International Airport (MCO) which experienced a peak maximum delay of 197 minutes. These findings come from travelandtournews.com’s comprehensive aggregation of the FAA’s official delay feed, sampled every 20 minutes throughout the day.
Delay Programmes Affected 21 Airports with Varied Duration and Severity
The delay programmes comprised seven ground stop programmes, where departures bound for affected airports were held at their origin, and four ground delay programmes, which meter arrivals by assigning later departure times. Additionally, there were 17 general arrival/departure delay status reports.
Orlando International (MCO) was the most impacted airport, subject to multiple delay programmes throughout the afternoon and evening. A ground stop program related to thunderstorms was active from 18:40 to 19:40 (1 hour) with no recorded average delay at that time but was followed by a ground delay program lasting 2 hours 40 minutes with a peak average delay
of 47 minutes and a peak maximum delay of 197 minutes.
San Francisco International (SFO) also faced extensive delay programs, including a ground stop program caused by airport volume lasting 40 minutes early in the day, and the longest-running ground delay program, spanning 22 hours and 40 minutes with a peak delay of 46 average minutes and a maximum of 208 minutes attributed to other causes.
Other ground stop programmes lasted from 20 to 40 minutes at airports including Denver (DEN), Aspen (ASE), YUL, Charlotte (CLT), and Chicago O’Hare (ORD), with causes ranging from thunderstorms to airspace volume and equipment
outage.
| Airport | FAA programme | Cause | Peak average delay | In force (UTC) |
|---|---|---|---|---|
| Orlando International (MCO) | Ground Stop Programs | thunderstorms | – | 18:40 to 19:40 (1 hour) |
| Denver International (DEN) | Ground Stop Programs | thunderstorms | – | 00:00 to 00:40 (40 minutes) |
| San Francisco International (SFO) | Ground Stop Programs | airport volume | – | 04:40 to 05:20 (40 minutes) |
| ASE | Ground Stop Programs | airspace volume | – | 16:20 to 17:00 (40 minutes) |
| YUL | Ground Stop Programs | equipment outage | – | 19:20 to 20:00 (40 minutes) |
| Chicago O’Hare International (ORD) | Ground Stop Programs | thunderstorms | – | 12:40 to 12:40 (20 minutes) |
| Charlotte Douglas International (CLT) | Ground Stop Programs | thunderstorms | – | 19:00 to 19:20 (20 minutes) |
| Orlando International (MCO) | Ground Delay Programs | thunderstorms | 47 min | 20:00 to 22:40 (2 hours 40 minutes) |
| San Francisco International (SFO) | Ground Delay Programs | other | 46 min | 00:00 to 22:40 (22 hours 40 minutes) |
| YYC | Ground Delay Programs | runway construction | 30 min | 00:00 to 01:40 (1 hour 40 minutes) |
| San Diego International (SAN) | Ground Delay Programs | airport volume | 17 min | 00:20 to 03:20 (3 hours) |
| Orlando International (MCO) | General Arrival/Departure Delay Info | STAFF:Staffing; TM Initiatives:MIT:WX | 91 min | 14:00 to 22:40 (8 hours 40 minutes) |
| Tampa International (TPA) | General Arrival/Departure Delay Info | WX:Thunderstorms; TM Initiatives:MIT:WX | 91 min | 15:40 to 22:00 (6 hours 20 minutes) |
| Miami International (MIA) | General Arrival/Departure Delay Info | TM Initiatives:MIT:WX; TM Initiatives:ESP:VOL; WX:Thunderstorms | 76 min | 00:00 to 22:40 (22 hours 40 minutes) |
Thunderstorms and Traffic Management Initiatives Major Causes of Delay
The most frequently cited causes in the programmes were air traffic management initiatives in mountainous areas and weather-related issues, particularly thunderstorms. The FAA’s stated reasons identified “TM Initiatives:MIT:WX” as the driver of 36 programmes, followed closely by thunderstorm-related delays—reported under “WX:Thunderstorms” at 34 programmes and “thunderstorms” at another 18.
Other common causes included airport volume, responsible for 13 programmes, and a mix of equipment outages, runway construction, wind, and operational runway changes. Several programmes attributed delays to general or “other” causes without further specification by the FAA.
More Airports and Programmes Than Yesterday But Within Weekly Averages
Compared to July 31, 2026, there was an increase in both the
number of affected airports and the total programmes active on August 1. Yesterday, 16 US airports were under FAA delay programmes with 20 programmes in total. The current day’s figures mark a rise of 5 in affected airports and 8 in programmes.
However, against the average across the previous seven days, which recorded 18.9 airports affected daily and 20 programmes, today’s data does not represent the highest figures in the tracking window. The average delays reached a peak of 91 minutes with maximum delays up to 208 minutes on this day, aligning with typical levels observed in recent days.
Methodology.
travelandtournews.com samples the FAA’s National Airspace System status feed every 20 minutes throughout the US operating day and aggregates the result. This report is built from 66 samples taken between 00:00 and 22:40 UTC on 2026-08-01. Durations are the observed window between the first and last sample in which a programme was in force, so a programme’s true length may be slightly longer than shown. Ground stops, ground delay programmes, airport closures and general delays are all published by the FAA in real time; the daily aggregation is ours.