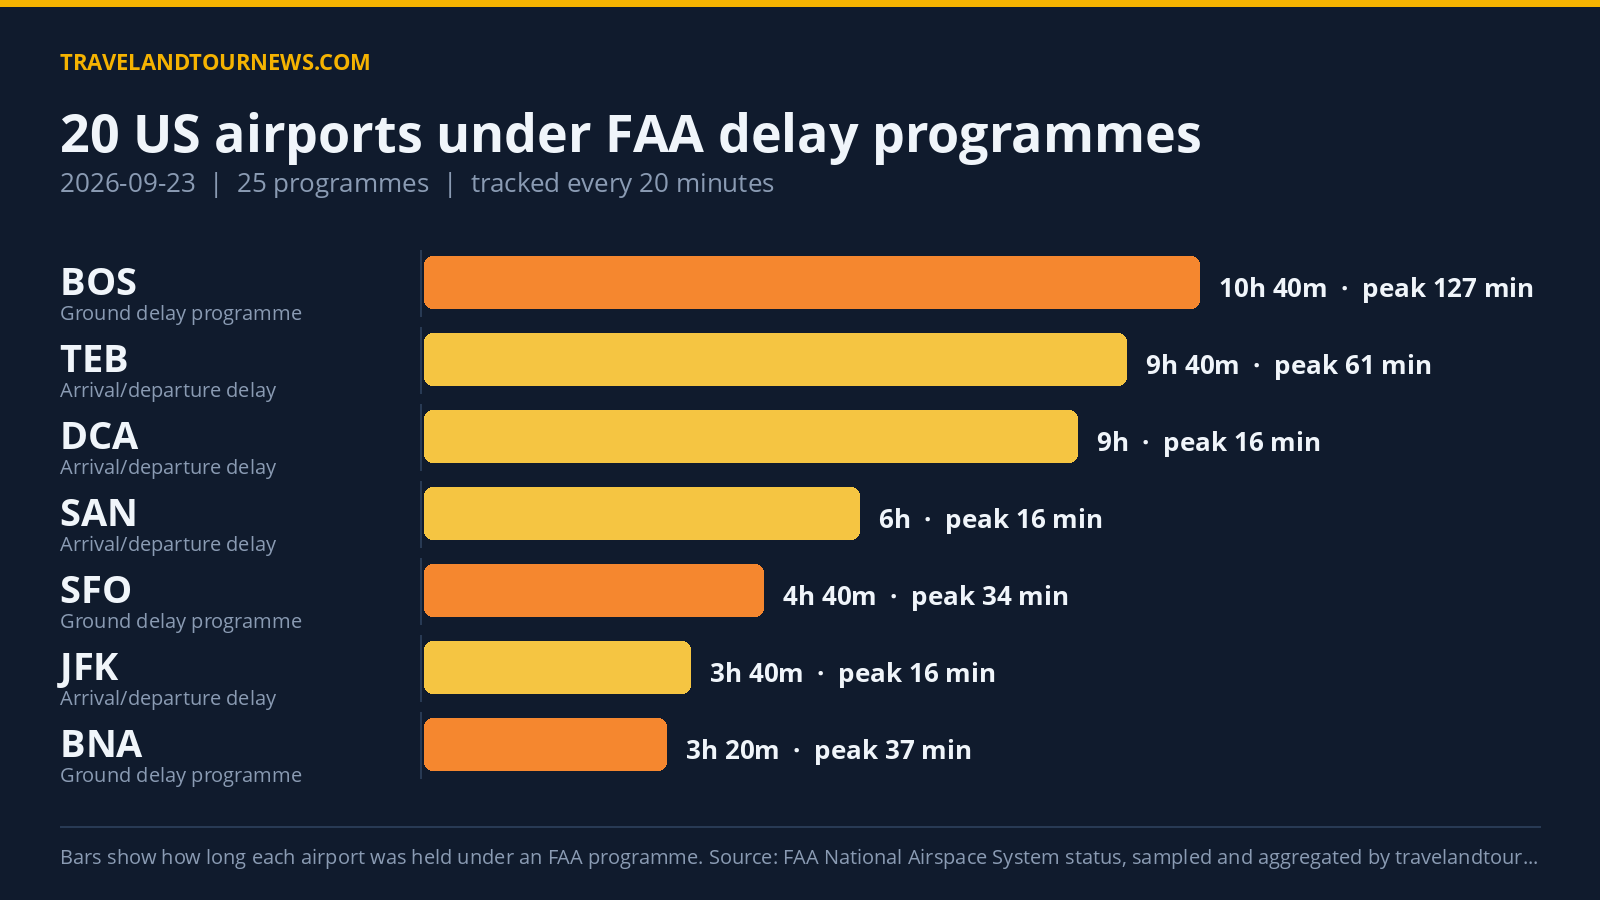

On September 23, 2026, FAA delay programmes impacted 20 airports across the United States with a total of 25 active programmes reported. The airport most affected was Ronald Reagan Washington National (DCA), which was under a ground stop programme for 2 hours and 20 minutes, between midnight and 2:20 a.m. UTC.
Details of Affected Airports and Programmes
The delay programmes included 6 ground stop programmes, which hold departures bound for an airport on the ground, 3 ground delay programmes that meter arrivals by assigning later departure times, and 16 general arrival/departure delay information reports. DCA’s ground stop, triggered by an equipment outage and additional unspecified reasons, was the longest ground stop observed, lasting 140 minutes though it did not record measurable peak average or maximum delay minutes.
Other ground stops included Washington Dulles International (IAD) with a runway construction-related ground stop lasting 20 minutes from 14:40 to 15:00 UTC and Boston Logan International (BOS) under a runway
construction ground stop for 20 minutes between 20:20 and 20:40 UTC. Nashville (BNA) and LaGuardia (LGA) also had short ground stops for “other” and airport volume reasons respectively. Austin (AUS) experienced a 20-minute ground stop due to thunderstorms starting at 22:40 UTC.
Among ground delay programmes, Boston Logan (BOS) faced a major impact due to runway construction, with the programme active for 10 hours and 40 minutes, registering a peak average delay of 127 minutes and a maximum delay reaching 508 minutes. Nashville (BNA) had a ground delay programme attributed to “other” causes lasting 3 hours and 20 minutes with
peak average delays of 37 minutes. San Francisco International (SFO) recorded a ground delay programme lasting 4 hours and 40 minutes driven by low ceilings, with a peak average delay of 34 minutes and a maximum of 83 minutes.
| Airport | FAA programme | Cause | Peak average delay | In force (UTC) |
|---|---|---|---|---|
| Ronald Reagan Washington National (DCA) | Ground Stop Programs | equipment outage; other | – | 00:00 to 02:20 (2 hours 20 minutes) |
| Washington Dulles International (IAD) | Ground Stop Programs | runway construction | – | 14:40 to 15:00 (20 minutes) |
| BNA | Ground Stop Programs | other | – | 18:40 to 19:00 (20 minutes) |
| Boston Logan International (BOS) | Ground Stop Programs | runway construction | – | 20:20 to 20:40 (20 minutes) |
| LaGuardia (LGA) | Ground Stop Programs | airport volume | – | 22:20 to 22:20 (20 minutes) |
| AUS | Ground Stop Programs | thunderstorms | – | 22:40 to 22:40 (20 minutes) |
| Boston Logan International (BOS) | Ground Delay Programs | runway construction | 127 min | 12:00 to 22:40 (10 hours 40 minutes) |
| BNA | Ground Delay Programs | other | 37 min | 19:20 to 22:40 (3 hours 20 minutes) |
| San Francisco International (SFO) | Ground Delay Programs | low ceilings | 34 min | 13:20 to 18:00 (4 hours 40 minutes) |
| CLE | General Arrival/Departure Delay Info | TM Initiatives:Metering:VOL | 76 min | 19:20 to 20:00 (40 minutes) |
| Pittsburgh International (PIT) | General Arrival/Departure Delay Info | TM Initiatives:Metering:VOL | 76 min | 19:20 to 20:00 (40 minutes) |
| TEB | General Arrival/Departure Delay Info | VOL:Volume; TM Initiatives:Metering:VOL; TM Initiatives:Metering:INDIVIDUAL RELEASES | 61 min | 13:00 to 22:40 (9 hours 40 minutes) |
| BUF | General Arrival/Departure Delay Info | TM Initiatives:Metering:VOL | 61 min | 19:20 to 19:40 (20 minutes) |
| Detroit Metropolitan Wayne County (DTW) | General Arrival/Departure Delay Info | TM Initiatives:Metering:VOL | 61 min | 19:20 to 19:40 (20 minutes) |
The general delay information programmes affected airports including Cleveland (CLE), Pittsburgh (PIT), Teterboro (TEB), Buffalo (BUF), Detroit Metropolitan (DTW), DCA for compacted demand and VIP movements, San Diego (SAN), John F. Kennedy International (JFK), LaGuardia (LGA), Van Nuys (VNY), Baltimore/Washington International (BWI), Denver International (DEN), Miami International (MIA), and Phoenix Sky Harbor (PHX). These programmes often concerned volume-based metering initiatives and runway construction, with average delays mostly around 16 to 76 minutes and durations ranging from 20 minutes to 9 hours 40 minutes in the case of Teterboro.
Top Causes Driving FAA Delay Programmes
FAA data attributes the majority of delay programmes to runway construction, responsible for 37 reported programmes. This was followed by compacted demand at 25 instances, and various other unspecified reasons totaling 20 programmes. Traffic management initiatives related to metering volume accounted for 16 programmes, and low ceilings caused 15 programmes.
Runway construction was the cause of all ground delay programmes in
Boston, one ground stop at Washington Dulles, and runway construction-related general delay info at Baltimore/Washington International and Miami International. Compacted demand impacted several airports including Washington National (DCA), San Diego (SAN), and Van Nuys (VNY). Weather phenomena such as thunderstorms affected Austin’s ground stop programme, while low ceilings impacted San Francisco’s ground delay programme.
Trend Comparison with Previous Day and Weekly Average
The 20 airports affected on September 23 represent an increase of 9 airports from the prior day’s 11 affected airports. The total of 25 programmes is 7 higher than yesterday’s 18. Relative to the recent seven-day average of approximately 16.6 airports and 18 programmes, the day
shows notably heavier delays, though this is not the highest in the tracking window.
Data sourced from FAA delay feeds tracked by travelandtournews.com.
Methodology. travelandtournews.com samples the FAA’s National Airspace System status feed every 20 minutes throughout the US operating day and aggregates the result. This report is built from 69 samples taken between 00:00 and 22:40 UTC on 2026-09-23. Durations are the observed window between the first and last sample in which a programme was in force, so a programme’s true length may be slightly longer than shown. Ground stops, ground delay programmes, airport closures and general delays are
all published by the FAA in real time; the daily aggregation is ours.