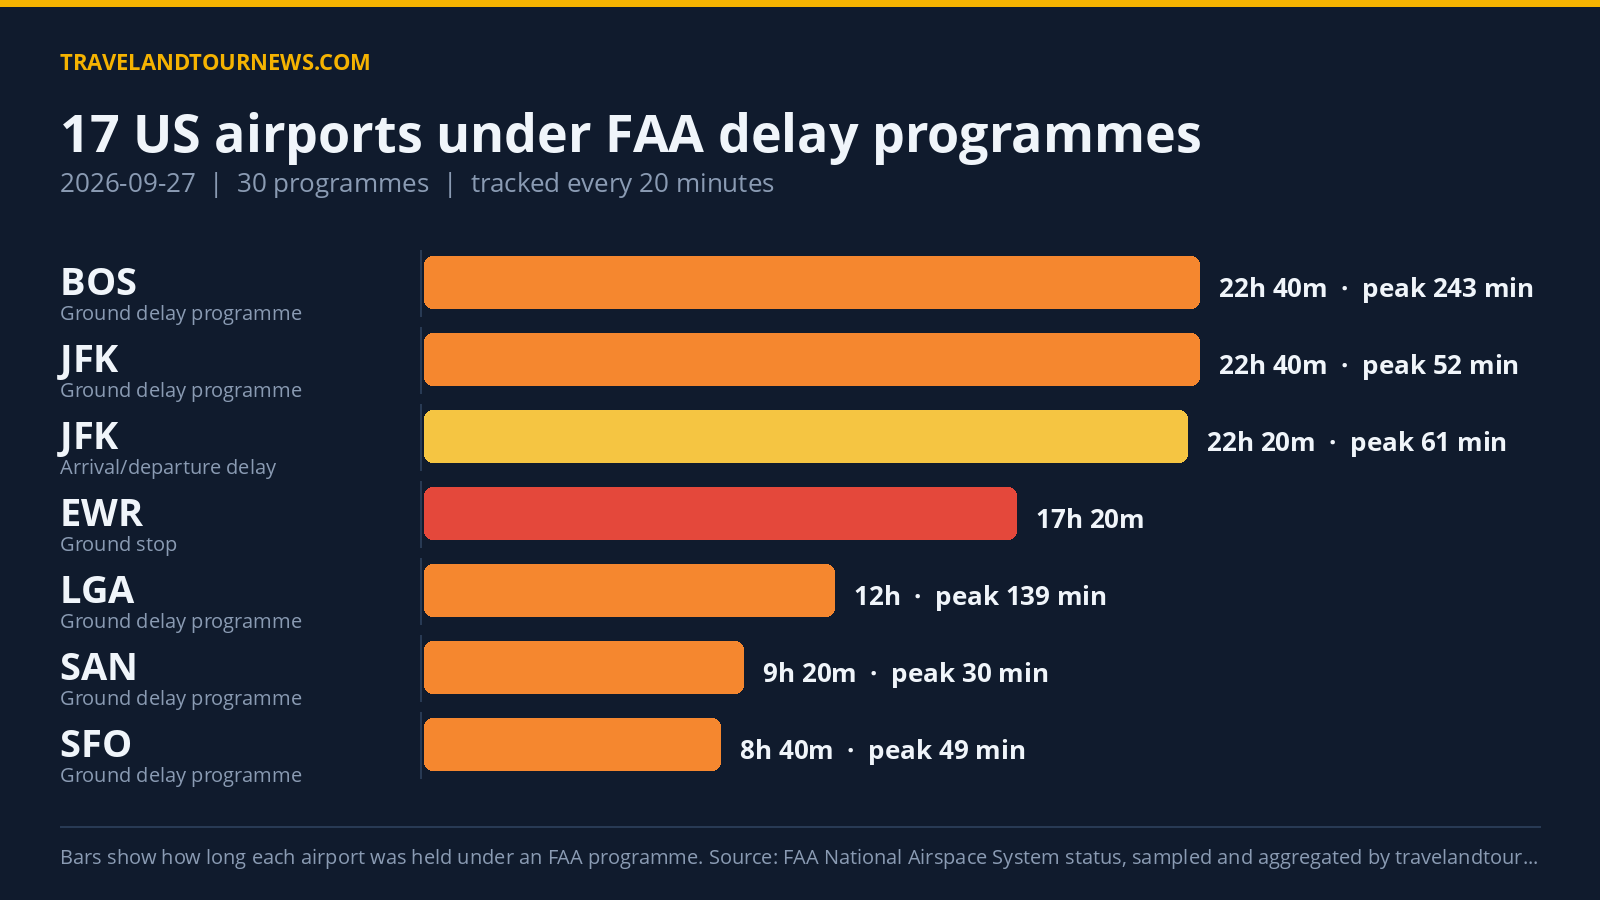

On September 27, 2026, the Federal Aviation Administration (FAA) enforced 30 delay programmes across 17 United States airports. Newark Liberty International Airport (EWR) was the worst affected, enduring a ground stop programme linked to wind lasting over 17 hours and producing peak delays reaching 0 minutes — no average or maximum delays recorded but the longest program duration in observed data.
Airports and Delay Programme Details
The 17 airports under delay programmes included AUS, BOS, DCA, DFW, EWR, HPN, JFK, LAS, LGA, MIA, MSP, ORD, PHL, SAN, SEA, SFO, and TEB. The FAA administered seven ground stop programmes, nine ground delay programmes, and 14 general arrival/departure delay advisories.
A ground stop holds outbound departures on the ground before takeoff for the affected airport, while a ground delay programme meters arrivals by assigning later departure times to flights bound for the airport.
Newark Liberty faced a wind-related ground stop lasting 17 hours 20 minutes from 00:00 to 17:20 UTC. Chicago O’Hare (ORD) experienced a ground stop of
8 hours linked to staffing, low visibility, and VIP movement between noon and 20:00 UTC. Austin (AUS) had a runway construction-related ground stop lasting 2 hours 40 minutes in the late afternoon and early evening.
Ground delay programmes with longer durations included Boston Logan (BOS) with a wind-caused delay lasting 22 hours 40 minutes, peaking at an average delay of 243 minutes and max delay of 873 minutes, the highest among all programmes. LaGuardia (LGA) endured a 12-hour ground delay due to wind and low visibility producing a peak average delay of 139 minutes. San Diego (SAN) faced airport volume-driven
ground delay lasting over 9 hours with a peak average delay of 30 minutes. Other significant ground delays affected JFK, SFO, PHL, and EWR, mostly attributed to wind or low ceilings.
| Airport | FAA programme | Cause | Peak average delay | In force (UTC) |
|---|---|---|---|---|
| Newark Liberty International (EWR) | Ground Stop Programs | wind | – | 00:00 to 17:20 (17 hours 20 minutes) |
| Chicago O’Hare International (ORD) | Ground Stop Programs | STAFFING; low visibility; VIP | – | 12:00 to 20:00 (8 hours) |
| AUS | Ground Stop Programs | runway construction | – | 17:20 to 20:00 (2 hours 40 minutes) |
| LaGuardia (LGA) | Ground Stop Programs | wind | – | 12:40 to 14:40 (2 hours) |
| Seattle-Tacoma International (SEA) | Ground Stop Programs | runway construction | – | 00:20 to 00:40 (20 minutes) |
| Boston Logan International (BOS) | Ground Stop Programs | wind | – | 18:40 to 19:00 (20 minutes) |
| TEB | Ground Stop Programs | low ceilings | – | 20:00 to 20:00 (20 minutes) |
| Boston Logan International (BOS) | Ground Delay Programs | WIND; wind | 243 min | 00:00 to 22:40 (22 hours 40 minutes) |
| LaGuardia (LGA) | Ground Delay Programs | low visibility; wind | 139 min | 10:40 to 22:40 (12 hours) |
| Chicago O’Hare International (ORD) | Ground Delay Programs | other | 88 min | 13:00 to 16:00 (3 hours) |
| TEB | Ground Delay Programs | low ceilings | 64 min | 20:20 to 21:40 (1 hour 20 minutes) |
| John F. Kennedy International (JFK) | Ground Delay Programs | wind | 52 min | 00:00 to 22:40 (22 hours 40 minutes) |
| San Francisco International (SFO) | Ground Delay Programs | low ceilings | 49 min | 12:40 to 21:20 (8 hours 40 minutes) |
| Philadelphia International (PHL) | Ground Delay Programs | wind | 48 min | 17:40 to 22:40 (5 hours) |
Delay Causes with Wind Dominating
Wind was the prevalent reason for programme activation, appearing in 118 samples followed by low ceilings at 33 samples. Related weather causes including “WX:Wind” appeared in 32 samples, and initiatives linked to weather-related traffic management accounted for 20 samples. Airport volume caused 29 samples while staffing, VIP movements, runway construction, and bird strikes contributed to other delays.
Wind affected multiple airports across programme types, including all seven ground stops
directly linked with wind at EWR, BOS, LGA, and others. Water ceilings and low visibility further contributed to delays at LGA and ORD.
Comparison with Previous Days
The 17 affected airports represent an increase of six compared with yesterday’s 11 airports impacted by FAA delay programmes. The total number of programmes rose from 20 to 30 compared to yesterday. The 17 airports affected today is slightly above the recent 7-day average of 16 airports, but not the highest in the tracking window.
Methodology. travelandtournews.com samples the FAA’s National Airspace System status feed every 20 minutes throughout the US operating day and aggregates the result.
This report is built from 69 samples taken between 00:00 and 22:40 UTC on 2026-09-27. Durations are the observed window between the first and last sample in which a programme was in force, so a programme’s true length may be slightly longer than shown. Ground stops, ground delay programmes, airport closures and general delays are all published by the FAA in real time; the daily aggregation is ours.