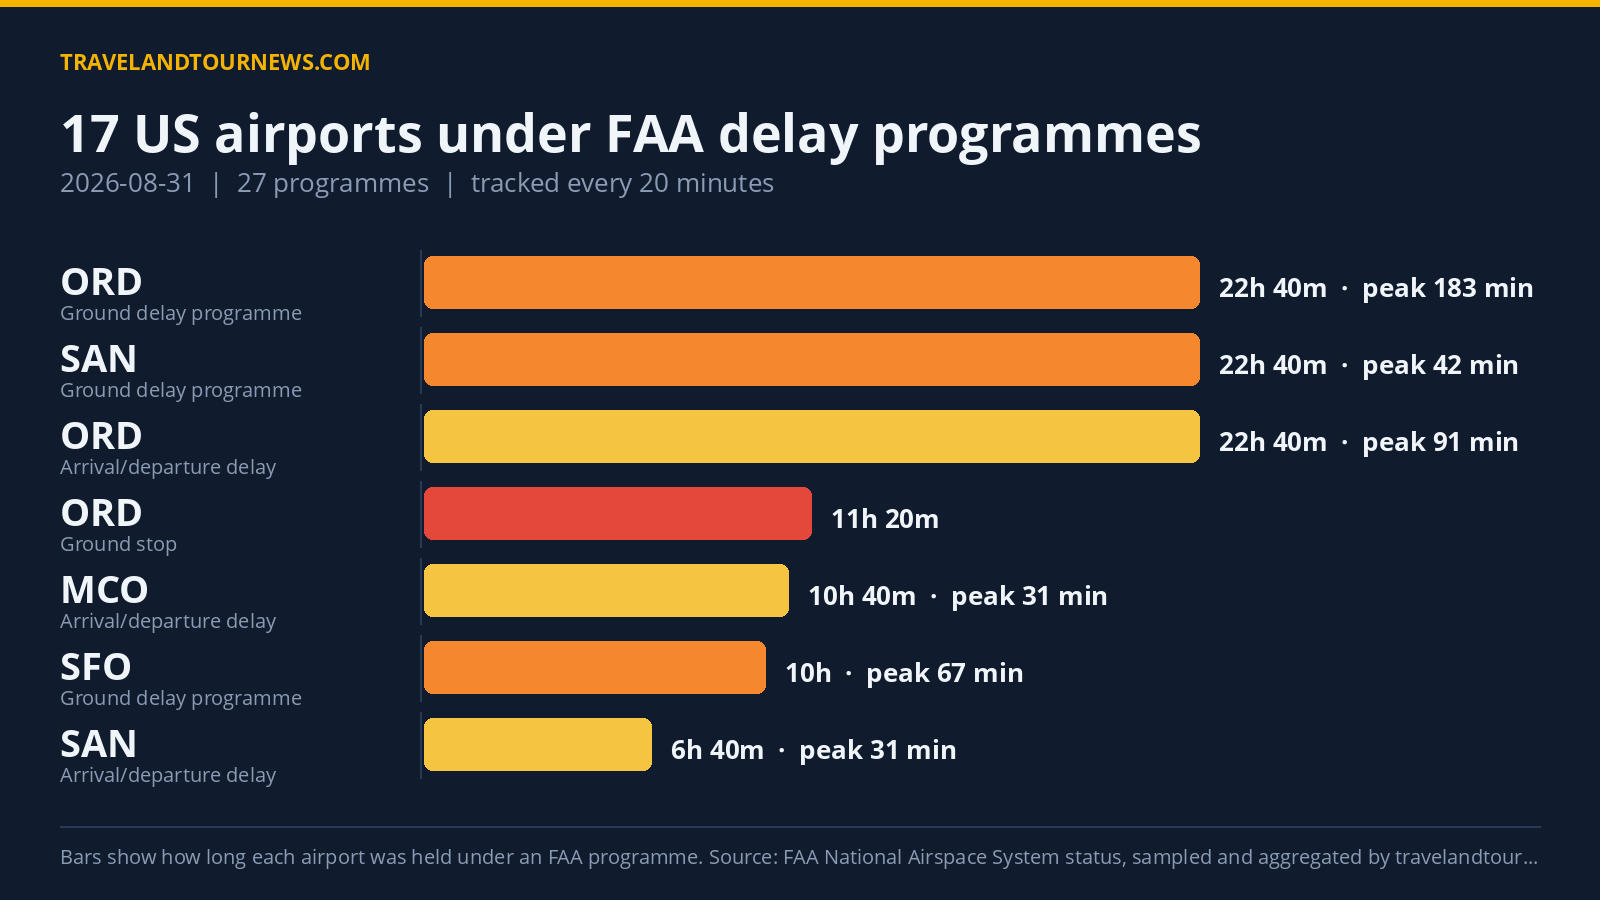

On August 31, 2026, FAA delay programmes covered 17 airports across the United States with a total of 27 programmes. Chicago O’Hare International (ORD) was the worst affected airport, experiencing a peak ground delay programme delay of 1,132 minutes.
Details on Airports and Delay Programmes
Among the 17 affected airports, six ground stop programmes were in effect, which hold departures bound for an airport on the ground at their origin. Seven ground delay programmes, which meter arrivals by assigning later departure times, and 14 instances of general arrival and departure delay information were also reported.
The longest ground delay programme was at ORD, lasting 22 hours and 40 minutes from 00:00 to 22:40 UTC, with a peak average delay of 183 minutes and a maximum delay of 1,132 minutes. ORD also had a ground stop programme related to thunderstorms lasting 11 hours and 20 minutes
starting at 11:20 UTC.
Other airports with ground stop programmes due to thunderstorms included Phoenix Sky Harbor International (PHX) for 1 hour 40 minutes and Denver International (DEN) for 1 hour, supplemented by wind in DEN’s case. Ronald Reagan Washington National (DCA) experienced a 40-minute ground stop due to thunderstorms.
Salt Lake City International (SLC) and Boston Logan International (BOS) had ground stops related to runway maintenance and construction respectively, each lasting around 20 minutes. BOS also had a ground delay programme due to runway construction lasting 1 hour 40 minutes with peak delays up to 86 minutes.
San Diego
International (SAN) ran a ground delay programme driven by airport volume for 22 hours 40 minutes, with a peak average delay of 42 minutes. San Francisco International (SFO) had a 10-hour ground delay programme caused by low ceilings, peaking at 67 average delay minutes.
Other notable ground delay programmes included DCA with low ceilings and thunderstorms for 3 hours 40 minutes, YUL for a 20-minute thunderstorm-related delay, and Denver International with a 1-hour thunderstorm delay.
General arrival and departure delay information covered airports including ORD, PHX, DEN, MCO, SAN, LAS, DCA, JFK, SFO, and SEA for varying durations and delay
levels.
| Airport | FAA programme | Cause | Peak average delay | In force (UTC) |
|---|---|---|---|---|
| Chicago O’Hare International (ORD) | Ground Stop Programs | thunderstorms | – | 11:20 to 22:40 (11 hours 20 minutes) |
| Phoenix Sky Harbor International (PHX) | Ground Stop Programs | thunderstorms | – | 04:00 to 05:40 (1 hour 40 minutes) |
| Denver International (DEN) | Ground Stop Programs | thunderstorms; wind | – | 00:00 to 01:00 (1 hour) |
| Ronald Reagan Washington National (DCA) | Ground Stop Programs | thunderstorms | – | 00:00 to 00:40 (40 minutes) |
| Salt Lake City International (SLC) | Ground Stop Programs | runway maintenance | – | 00:40 to 01:00 (20 minutes) |
| Boston Logan International (BOS) | Ground Stop Programs | runway construction | – | 18:40 to 19:00 (20 minutes) |
| Chicago O’Hare International (ORD) | Ground Delay Programs | thunderstorms | 183 min | 00:00 to 22:40 (22 hours 40 minutes) |
| YUL | Ground Delay Programs | thunderstorms | 101 min | 00:00 to 00:20 (20 minutes) |
| Ronald Reagan Washington National (DCA) | Ground Delay Programs | low ceilings; thunderstorms | 69 min | 00:00 to 03:40 (3 hours 40 minutes) |
| San Francisco International (SFO) | Ground Delay Programs | low ceilings | 67 min | 12:40 to 22:40 (10 hours) |
| Denver International (DEN) | Ground Delay Programs | thunderstorms | 47 min | 00:00 to 01:00 (1 hour) |
| San Diego International (SAN) | Ground Delay Programs | airport volume | 42 min | 00:00 to 22:40 (22 hours 40 minutes) |
| Boston Logan International (BOS) | Ground Delay Programs | runway construction | 34 min | 19:20 to 21:00 (1 hour 40 minutes) |
| Chicago O’Hare International (ORD) | General Arrival/Departure Delay Info | WX:Thunderstorms | 91 min | 00:00 to 22:40 (22 hours 40 minutes) |
Thunderstorms Led Most Delay Programmes
Thunderstorms were the primary cause of FAA delay programmes on August 31, occurring 70 times across sampled programmes. The next largest cause was TM Initiatives:MIT:WX with 40 occurrences, followed by airport volume with 39, low ceilings with 34, and WX thunderstorm mentions at 27.
Thunderstorms drove ground stop programmes at ORD, PHX, DEN, and DCA and also drove many ground delay programmes such as at ORD, DCA, DEN, and YUL. Airport volume was the main cause at San Diego International for its prolonged ground delay programme. Runway construction and maintenance were the causes for ground stops at BOS and
SLC respectively.
Delay Levels and Trend Comparison
The peak average delay across all programmes was 183 minutes, with the highest peak maximum delay reaching 1,132 minutes at ORD.
The longest delay programme lasted 1,360 minutes, or 22 hours 40 minutes, observed at both Chicago O’Hare International and San Diego International airports.
Compared with August 30, 2026, the number of affected airports remained stable at 17, and the total programmes count increased minimally from 26 to 27. The count of affected airports matches the weekly average of 17 over the previous seven days, indicating no significant change in scope or severity.
This reporting is based on
FAA data tracked by travelandtournews.com.
Methodology. travelandtournews.com samples the FAA’s National Airspace System status feed every 20 minutes throughout the US operating day and aggregates the result. This report is built from 69 samples taken between 00:00 and 22:40 UTC on 2026-08-31. Durations are the observed window between the first and last sample in which a programme was in force, so a programme’s true length may be slightly longer than shown. Ground stops, ground delay programmes, airport closures and general delays are all published by the FAA in real time; the daily aggregation is ours.