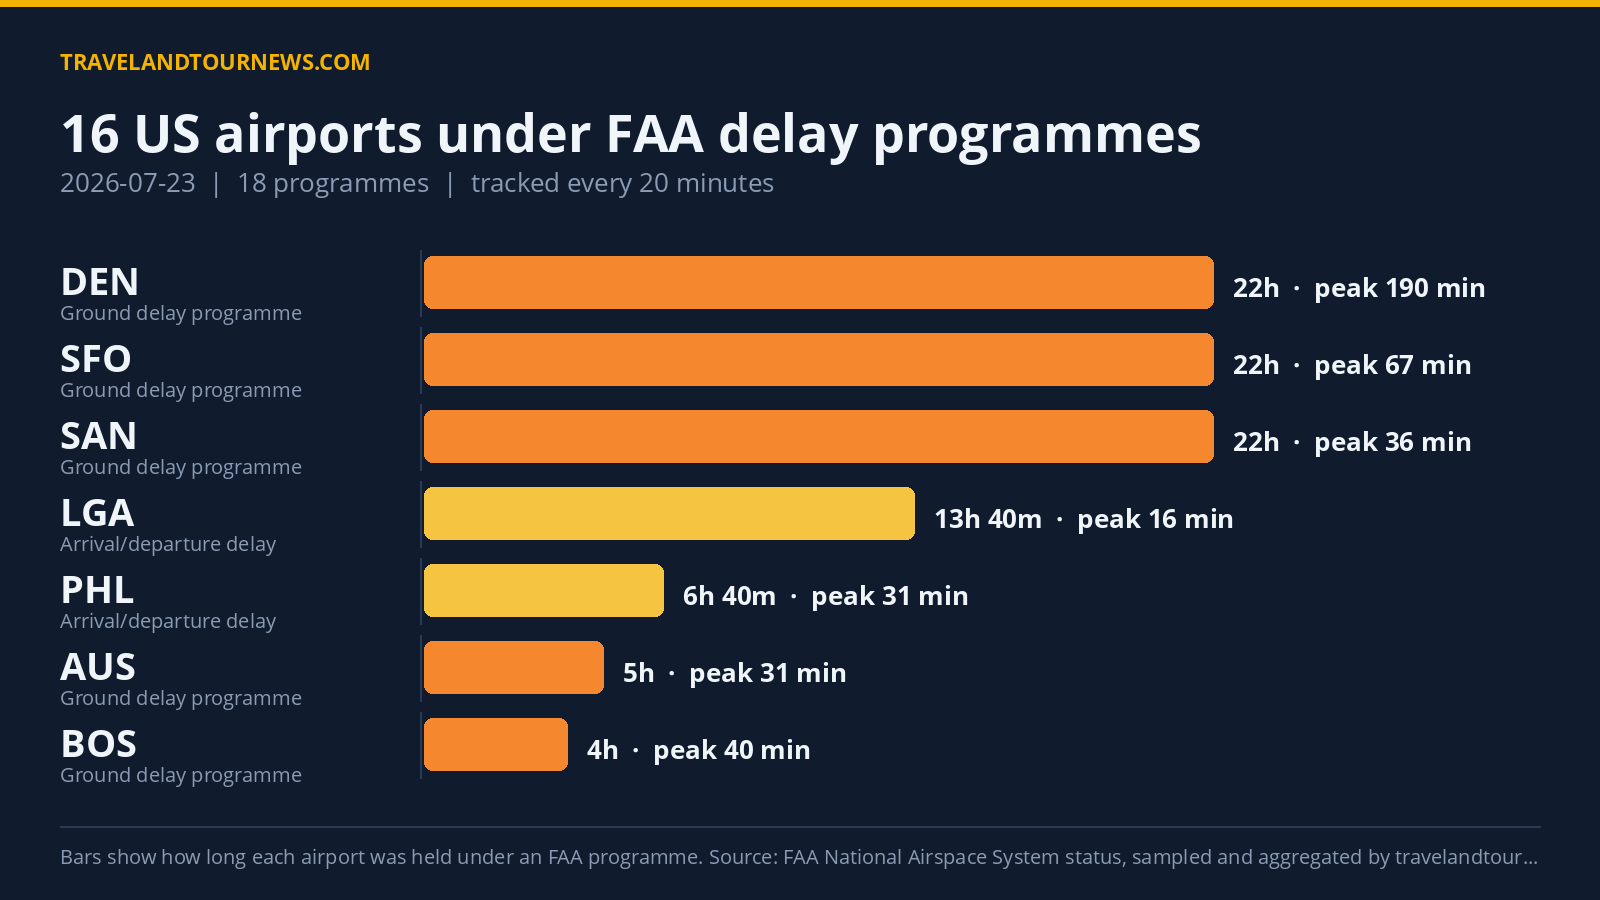

On July 23, 16 airports across the United States were affected by a total of 18 delay programmes issued by the FAA, according to official data tracked by travelandtournews.com. The worst-hit airport was Denver International (DEN), which experienced a peak delay reaching 499 minutes.
Overview of Airports and Programmes
Among the 16 impacted airports, the FAA implemented one ground stop programme, five ground delay programmes, and twelve instances of general arrival/departure delay information.
A ground stop programme holds departing flights destined for an airport on the ground before takeoff, while a ground delay programme meters arrivals by assigning later departure times.
The sole ground stop occurred at Aspen-Pitkin County Airport (ASE) due to airport volume and lasted 40 minutes from 15:40 to 16:20 UTC. Despite the halt, this programme recorded no average or maximum delay minutes.
Five ground delay programmes extended from several hours up to a full 22
hours at Denver, San Francisco (SFO), and San Diego (SAN). Denver’s programme lasted the longest, spanning 22 hours with average delays peaking at 190 minutes and maximum delays up to 499 minutes. San Francisco and San Diego also had 22-hour ground delay programmes, with peak average delays of 67 and 36 minutes respectively.
Boston Logan International (BOS) and Austin-Bergstrom International (AUS) had ground delay programmes lasting 4 and 5 hours respectively, with peak average delays from 31 to 40 minutes.
General arrival/departure delay information was logged at 12 airports, including New York’s JFK and LaGuardia (LGA), Washington D.C. (DCA), Miami
(MIA), Philadelphia (PHL), Newark Liberty (EWR), and others, with varied peak delays from 16 to 121 minutes and durations mostly under 14 hours.
| Airport | FAA programme | Cause | Peak average delay | In force (UTC) |
|---|---|---|---|---|
| ASE | Ground Stop Programs | airport volume | – | 15:40 to 16:20 (40 minutes) |
| Denver International (DEN) | Ground Delay Programs | thunderstorms | 190 min | 00:00 to 22:00 (22 hours) |
| San Francisco International (SFO) | Ground Delay Programs | other | 67 min | 00:00 to 22:00 (22 hours) |
| Boston Logan International (BOS) | Ground Delay Programs | wind | 40 min | 17:40 to 21:40 (4 hours) |
| San Diego International (SAN) | Ground Delay Programs | airport volume; VOLUME | 36 min | 00:00 to 22:00 (22 hours) |
| AUS | Ground Delay Programs | runway construction | 31 min | 17:00 to 22:00 (5 hours) |
| Ronald Reagan Washington National (DCA) | General Arrival/Departure Delay Info | STAFF:Staffing | 121 min | 00:00 to 00:00 (20 minutes) |
| Philadelphia International (PHL) | General Arrival/Departure Delay Info | TM Initiatives:SWAP:WX; TM Initiatives:Metering:VOL | 31 min | 14:20 to 21:00 (6 hours 40 minutes) |
| TEB | General Arrival/Departure Delay Info | TM Initiatives:SWAP:WX | 31 min | 19:40 to 22:00 (2 hours 20 minutes) |
| John F. Kennedy International (JFK) | General Arrival/Departure Delay Info | TM Initiatives:SWAP:WX | 31 min | 20:00 to 22:00 (2 hours) |
| Denver International (DEN) | General Arrival/Departure Delay Info | ZDV / WX:Thunderstorms | 31 min | 00:00 to 01:00 (1 hour) |
| LaGuardia (LGA) | General Arrival/Departure Delay Info | TM Initiatives:SWAP:WX | 16 min | 00:00 to 13:40 (13 hours 40 minutes) |
| Miami International (MIA) | General Arrival/Departure Delay Info | RWY:Construction | 16 min | 13:00 to 15:20 (2 hours 20 minutes) |
| Baltimore/Washington International (BWI) | General Arrival/Departure Delay Info | RWY:Construction | 16 min | 11:40 to 13:00 (1 hour 20 minutes) |
Delay Causes Grouped by Frequency
The FAA’s stated reasons for delay programmes were diverse. The leading cause was categorized as “other,” responsible for 42 programme samples. The next most frequent was “TM Initiatives:SWAP:WX” with 33 samples, indicating traffic management initiatives related to weather.
Airport volume was cited 29 times as a reason, including for the ASE ground stop and San Diego’s prolonged ground delay programme. Construction on runways or related issues appeared in 29 samples, combining runway construction and “RWY:Construction” categories.
Thunderstorms
caused significant delay impact, notably at Denver, which experienced a 22-hour ground delay programme due to these weather conditions. Wind was also a factor at Boston Logan.
Comparison With Previous Days and Averages
The 16 airports affected on July 23 match yesterday’s number, which also saw 16 airports impacted by FAA delay programmes. However, the total programmes today were 18, down from 26 yesterday.
Compared to the seven-day average of 21.9 airports affected, July 23’s figures represent a lower frequency of airport delays. The day is not the worst in the recent tracking window for this metric.
Methodology. travelandtournews.com samples the FAA’s National Airspace System status
feed every 20 minutes throughout the US operating day and aggregates the result. This report is built from 64 samples taken between 00:00 and 22:00 UTC on 2026-07-23. Durations are the observed window between the first and last sample in which a programme was in force, so a programme’s true length may be slightly longer than shown. Ground stops, ground delay programmes, airport closures and general delays are all published by the FAA in real time; the daily aggregation is ours.