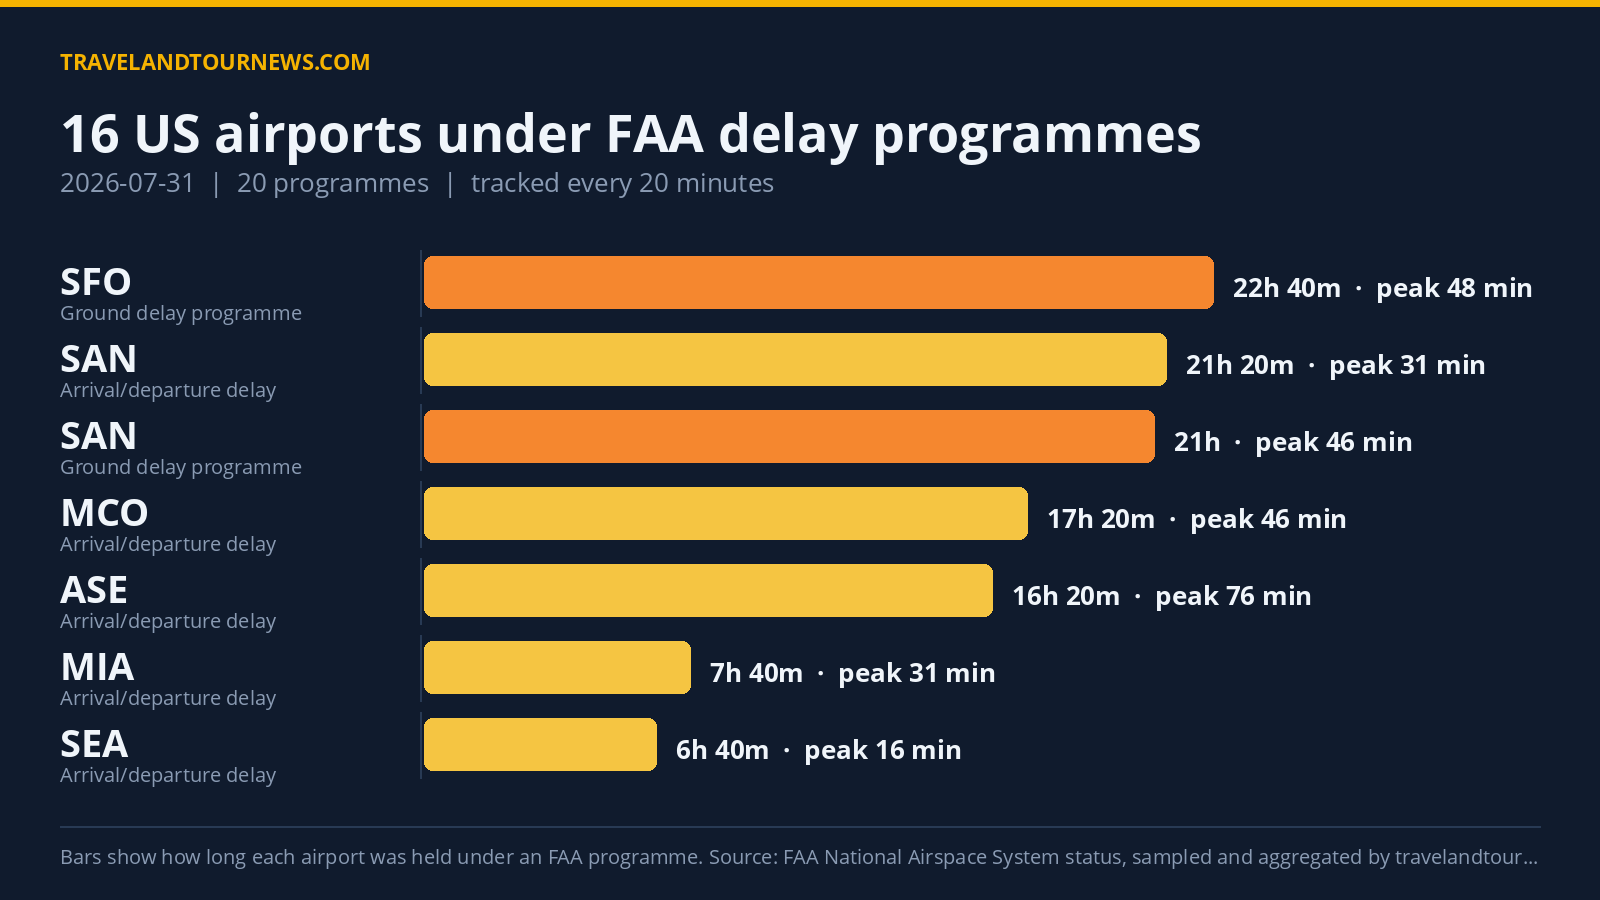

On July 31, 2026, the FAA had 16 US airports under 20 active delay programmes across the country. Orlando International Airport (MCO) experienced the most severe disruption with ground stop programmes related to thunderstorms, affecting operations for 40 minutes.
Airports and Delay Programmes on July 31, 2026
FAA’s delay management included three ground stop programmes, which hold departures at the origin airports, and five ground delay programmes that meter arrivals by assigning later departure times. The longest-running ground delay programme was at San Francisco International (SFO), lasting 22 hours and 40 minutes, peaking with average delays of 48 minutes and maximum delays reaching 208 minutes.
San Diego International (SAN) also had an extended ground delay lasting 21 hours, with peak delays averaging 46 minutes and reaching a maximum of 495 minutes. Orlando International’s ground stop due to thunderstorms was observed for 40 minutes, with no peak average
or maximum delays recorded during the sampled polls. Minneapolis-Saint Paul International (MSP) and Savannah (SAV) airports each had shorter ground stops of 20 minutes.
Other airports with ground delay programmes included Boston Logan International (BOS) with delays driven by low ceilings at 110 average minutes peak delay, Harry Reid International (LAS), and Calgary (YYC), which faced runway construction delays. Orlando International also had general arrival and departure delay info programmes related to weather mitigation strategies lasting over 17 hours.
| Airport | FAA programme | Cause | Peak average delay | In force (UTC) |
|---|---|---|---|---|
| Orlando International (MCO) | Ground Stop Programs | thunderstorms | – | 16:40 to 17:20 (40 minutes) |
| Minneapolis-Saint Paul International (MSP) | Ground Stop Programs | low ceilings | – | 19:00 to 19:20 (20 minutes) |
| SAV | Ground Stop Programs | disabled aircraft on the runway | – | 19:00 to 19:00 (20 minutes) |
| Boston Logan International (BOS) | Ground Delay Programs | low ceilings | 110 min | 00:00 to 00:00 (20 minutes) |
| San Francisco International (SFO) | Ground Delay Programs | other | 48 min | 00:00 to 22:40 (22 hours 40 minutes) |
| San Diego International (SAN) | Ground Delay Programs | airport volume | 46 min | 00:00 to 21:00 (21 hours) |
| Harry Reid International (LAS) | Ground Delay Programs | other | 37 min | 02:00 to 05:40 (3 hours 40 minutes) |
| YYC | Ground Delay Programs | runway construction | 30 min | 21:00 to 22:40 (1 hour 40 minutes) |
| ASE | General Arrival/Departure Delay Info | ASE / WX:Wind; VOL:Volume | 76 min | 00:00 to 16:20 (16 hours 20 minutes) |
| TEB | General Arrival/Departure Delay Info | RWY:Rwy Change – Operational Advantage; VOL:Multi-taxi; VIPM:VIP Movement | 76 min | 19:00 to 22:40 (3 hours 40 minutes) |
| Orlando International (MCO) | General Arrival/Departure Delay Info | TM Initiatives:MIT:WX | 46 min | 00:00 to 17:20 (17 hours 20 minutes) |
| San Diego International (SAN) | General Arrival/Departure Delay Info | VOL:Volume; VOL:Compacted Demand | 31 min | 00:00 to 21:20 (21 hours 20 minutes) |
| Miami International (MIA) | General Arrival/Departure Delay Info | TM Initiatives:ESP:VOL; TM Initiatives:MIT:WX | 31 min | 15:00 to 22:40 (7 hours 40 minutes) |
| Harry Reid International (LAS) | General Arrival/Departure Delay Info | TM Initiatives:MIT:STAFFING; RWY:Rwy Change – Operational Necessity | 31 min | 15:40 to 21:20 (5 hours 40 minutes) |
Additional airports with general arrival and departure delays spanned a range of reasons including runway construction, VIP movement, multi-taxi operations, and traffic management initiatives. For example, Tampa International (TPA) saw five hours and 20 minutes of delays driven by traffic management initiatives related to weather.
Causes Behind Programmes Focus on Weather and Airport Volume
The FAA identified several key causes driving the delays: ‘other’ reasons led with 60 programmes, followed by ‘airport volume’ at 31,
and weather-related traffic management initiatives such as ‘STOP:WX’ (stop for weather) at 17 programmes.
Compacted demand and weather mitigation initiatives were also frequently cited, with 14 and 13 programmes respectively. Ground stops at Orlando International were specifically triggered by thunderstorms, while other weather-related causes included low ceilings at Boston and Minneapolis-Saint Paul, and runway construction at Calgary.
Delay Count and Airport Impact Below Recent Averages
Compared to the previous day, which saw 23 airports affected and 37 programmes, July 31 had fewer disruptions, with 16 airports and 20 programmes. This represents a reduction of 7 programmes and 7 airports affected. The number of airports affected on July 31
also fell below the recent 7-day average of 18.7 airports.
July 31 was not the worst day in the recent tracking window. Peak average delay across all airports reached 110 minutes, while peak maximum delay hit 495 minutes, both linked to ground delay programmes at Boston and San Diego respectively.
Methodology. travelandtournews.com samples the FAA’s National Airspace System status feed every 20 minutes throughout the US operating day and aggregates the result. This report is built from 69 samples taken between 00:00 and 22:40 UTC on 2026-07-31. Durations are the observed window between the first and last sample in which
a programme was in force, so a programme’s true length may be slightly longer than shown. Ground stops, ground delay programmes, airport closures and general delays are all published by the FAA in real time; the daily aggregation is ours.