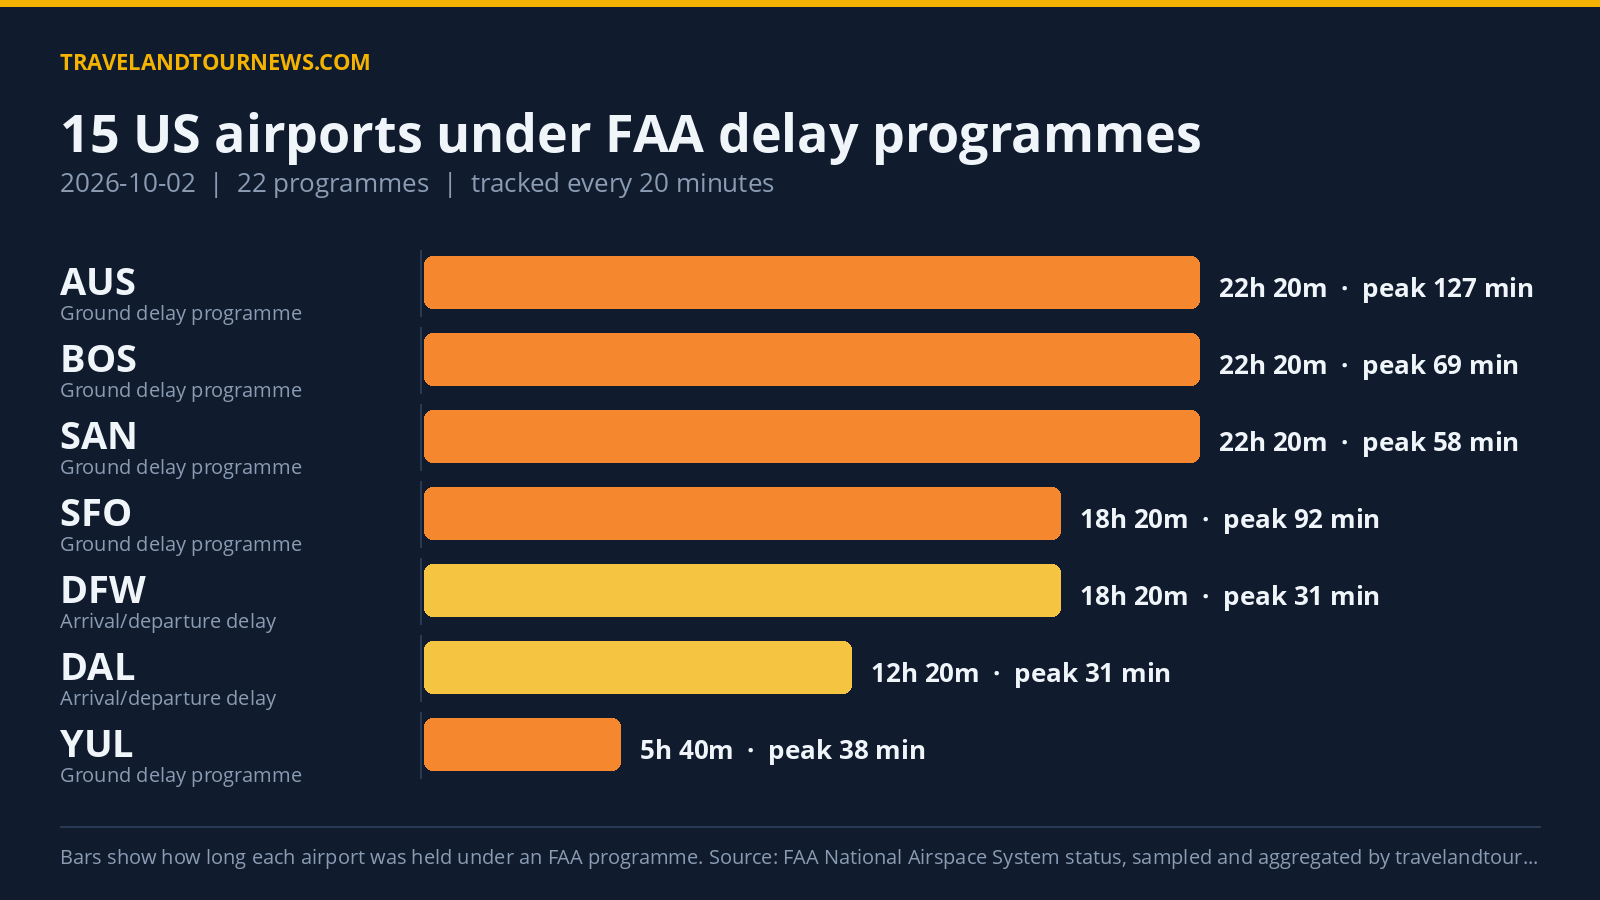

On October 2, 2026, the FAA held delay programmes affecting 15 airports across the United States, totaling 22 distinct programmes. Orlando International Airport (MCO) experienced the most severe impact with a ground stop programme due to thunderstorms lasting 1 hour and 20 minutes.
Delay Programmes Across Airports and Their Durations
The day’s delays comprised four ground stop programmes, eight ground delay programmes, and ten general arrival/departure delay infos. Ground stops keep departures bound for an airport on hold at their origin, while ground delay programmes meter arrivals by assigning later departure times.
Orlando International (MCO) had a ground stop for thunderstorms from 17:40 to 19:00 UTC, spanning 80 minutes. Chicago O’Hare (ORD) had two ground stops: one early morning for staffing and a disabled aircraft on the runway lasting 40 minutes, and a separate ground delay programme lasting 5 hours 20 minutes with peak average delays of 292 minutes.
Dallas/Fort
Worth (DFW) faced an 3 hour 40 minute ground delay programme with peak maximum delays of 1387 minutes causing the highest recorded max delay, and also had a general delay information programme running for 18 hours 20 minutes with thunderstorm and traffic management initiative reasons. Austin (AUS) had a notably long 22 hour 20 minute ground delay programme with peak average delays of 127 minutes due to thunderstorms and runway construction, alongside a 40-minute ground stop also for thunderstorms.
San Francisco International (SFO) was subject to an 18 hour 20 minute ground delay programme because of other operational causes and
low ceilings, with peak average delay of 92 minutes. Boston Logan (BOS), San Diego International (SAN), and Seattle-Tacoma International (SEA) also had multi-hour ground delay programmes usually tied to runway construction or airport volume.
Smaller general delay infos appeared at Washington Dulles (IAD), Philadelphia (PHL), Dallas Love Field (DAL), Harry Reid International (LAS), Teterboro (TEB), and others, most tied to weather or volume-related factors lasting between 20 minutes and several hours.
| Airport | FAA programme | Cause | Peak average delay | In force (UTC) |
|---|---|---|---|---|
| Orlando International (MCO) | Ground Stop Programs | thunderstorms | – | 17:40 to 19:00 (1 hour 20 minutes) |
| Chicago O’Hare International (ORD) | Ground Stop Programs | STAFFING; disabled aircraft on the runway | – | 02:20 to 03:00 (40 minutes) |
| AUS | Ground Stop Programs | thunderstorms | – | 16:40 to 17:20 (40 minutes) |
| George Bush Intercontinental (IAH) | Ground Stop Programs | thunderstorms | – | 22:20 to 22:20 (20 minutes) |
| Chicago O’Hare International (ORD) | Ground Delay Programs | other | 292 min | 00:00 to 05:20 (5 hours 20 minutes) |
| Dallas/Fort Worth International (DFW) | Ground Delay Programs | other | 144 min | 00:00 to 03:40 (3 hours 40 minutes) |
| AUS | Ground Delay Programs | thunderstorms; runway construction | 127 min | 00:00 to 22:20 (22 hours 20 minutes) |
| San Francisco International (SFO) | Ground Delay Programs | other; low ceilings | 92 min | 00:20 to 18:40 (18 hours 20 minutes) |
| Boston Logan International (BOS) | Ground Delay Programs | runway construction | 69 min | 00:00 to 22:20 (22 hours 20 minutes) |
| San Diego International (SAN) | Ground Delay Programs | airport volume | 58 min | 00:00 to 22:20 (22 hours 20 minutes) |
| YUL | Ground Delay Programs | runway construction | 38 min | 16:00 to 21:40 (5 hours 40 minutes) |
| Seattle-Tacoma International (SEA) | Ground Delay Programs | runway construction | 35 min | 00:00 to 03:40 (3 hours 40 minutes) |
| Orlando International (MCO) | General Arrival/Departure Delay Info | WX:Thunderstorms | 91 min | 18:40 to 22:20 (3 hours 40 minutes) |
| San Diego International (SAN) | General Arrival/Departure Delay Info | VOL:Compacted Demand | 46 min | 21:20 to 22:20 (1 hour) |
Top Causes of Delay Programmes
Runway construction was the top cause of delay programmes with 80 instances across programmes, followed by airport volume issues with 40, and other operational reasons contributing 38. Thunderstorms and
weather-related thunderstorm conditions appeared 40 times combined, split between “thunderstorms” (17) and “WX:Thunderstorms” (23) recorded by the FAA.
Weather factors primarily affected ground stop programmes at Orlando International, Austin, and George Bush Intercontinental (IAH). Operational and staffing issues caused ground stops at Chicago O’Hare. Airport volume and runway construction were the main drivers in ground delay programmes at San Diego, Boston, Seattle, and Montreal (YUL).
Trends Compared with Previous Data
The day’s 22 programmes at 15 airports represent a slight decrease from yesterday’s 27 programmes at 17 airports. The number of airports affected is just above the recent 7-day average of 14.3 airports, but the
total programmes are below the average, indicating a slight easing in overall delay activity.
Methodology. travelandtournews.com samples the FAA’s National Airspace System status feed every 20 minutes throughout the US operating day and aggregates the result. This report is built from 68 samples taken between 00:00 and 22:20 UTC on 2026-10-02. Durations are the observed window between the first and last sample in which a programme was in force, so a programme’s true length may be slightly longer than shown. Ground stops, ground delay programmes, airport closures and general delays are all published by the FAA in real time; the
daily aggregation is ours.