
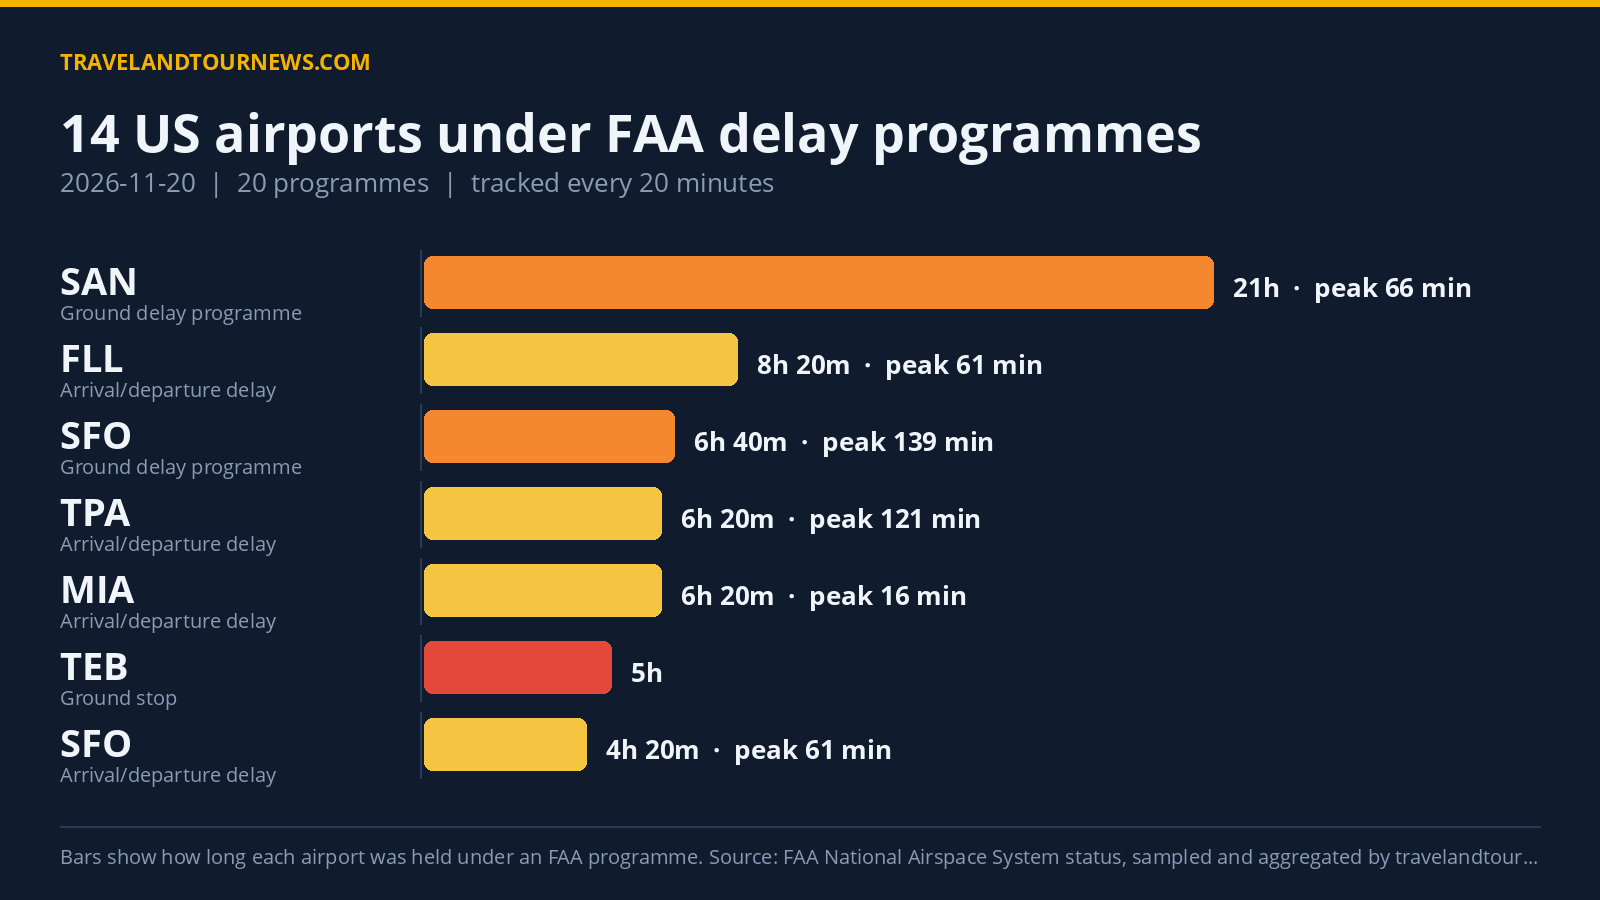

On November 20, 2026, the FAA operated 20 delay programmes affecting 14 airports across the United States. The airport with the most substantial impact was Teterboro Airport (TEB), facing a ground stop programme due to airport volume lasting five hours.
Airports and Delay Programmes in Force
Fourteen airports were affected by delay programmes on this date. Programmes consisted of five ground stops, three ground delay programmes, and twelve general arrival or departure delay information advisories. A ground stop holds departures bound for an airport on the ground at their origin, while a ground delay programme meters arrivals by assigning later departure times.
Ground stop programmes were observed at TEB for five hours (16:40 to 21:40 UTC), BFI for 1 hour 20 minutes, San Diego International (SAN) for 40 minutes, Harry Reid International (LAS) for 40 minutes, and AUS for 40 minutes. None of these recorded peak
average or maximum delays, but they represent operational pauses in departure clearance.
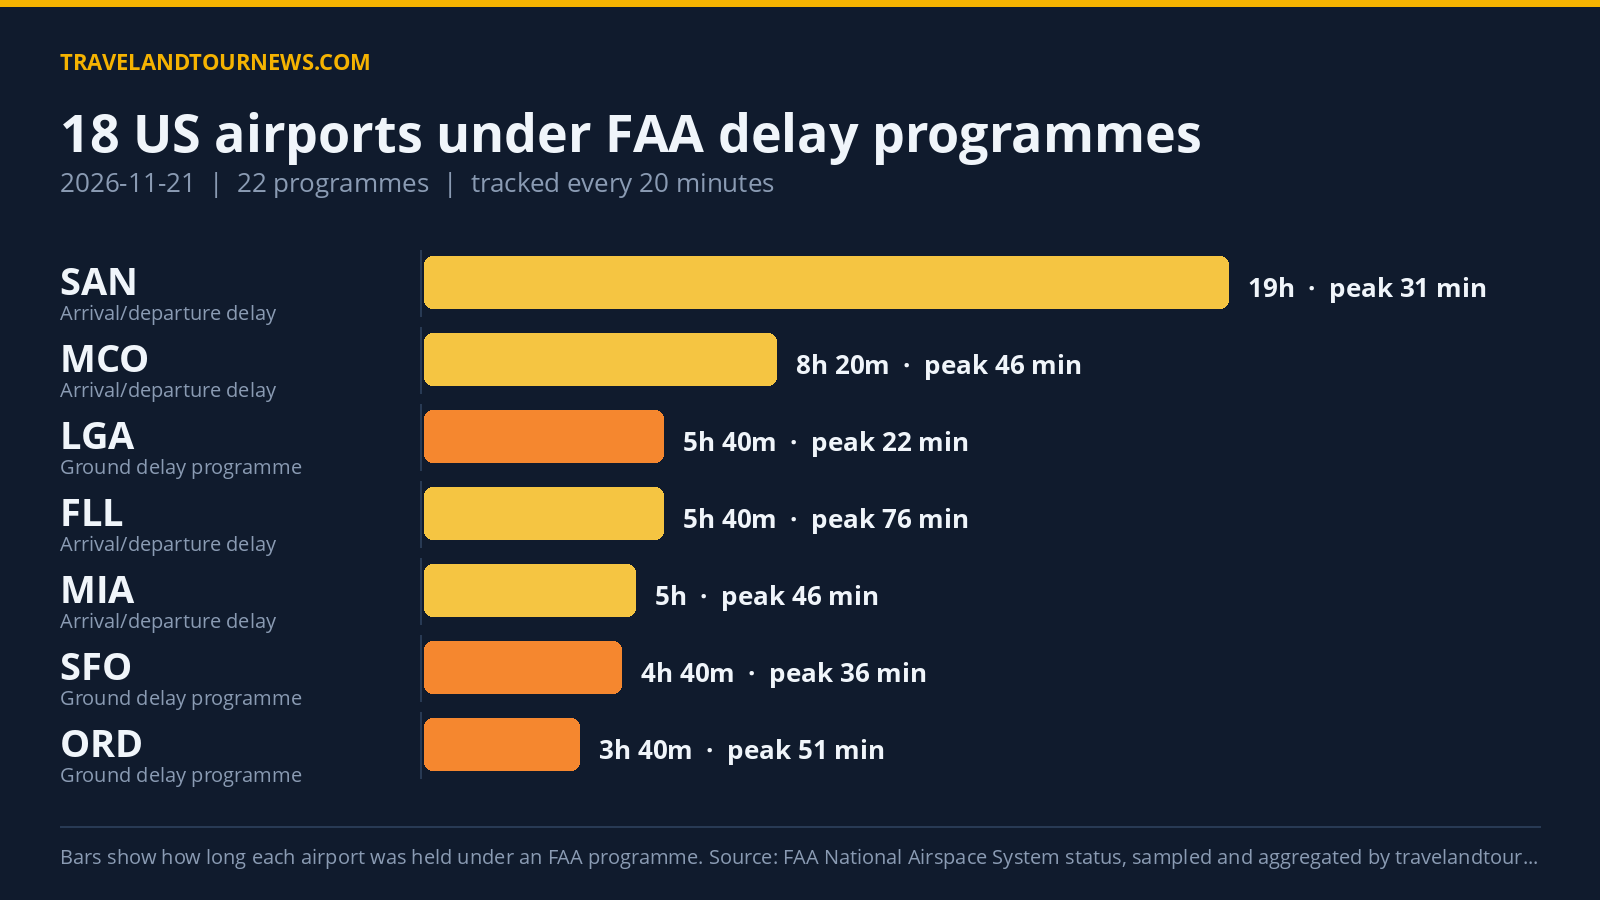
Ground delay programmes affected SAN for a record-long 21 hours (01:00 to 22:00 UTC), with peak average and maximum delays of 66 and 159 minutes respectively, driven by low visibility and airport volume. San Francisco International (SFO) had a ground delay programme lasting 6 hours 40 minutes with a peak average delay of 139 minutes and a maximum delay reaching 331 minutes, primarily due to low ceilings and low operations. Harry Reid International (LAS) experienced a 3 hour 40 minute ground delay due to low ceilings, with peak
delays up to 89 minutes.
| Airport | FAA programme | Cause | Peak average delay | In force (UTC) |
|---|---|---|---|---|
| TEB | Ground Stop Programs | airport volume | – | 16:40 to 21:40 (5 hours) |
| BFI | Ground Stop Programs | other | – | 19:20 to 20:40 (1 hour 20 minutes) |
| San Diego International (SAN) | Ground Stop Programs | low visibility | – | 00:00 to 00:40 (40 minutes) |
| Harry Reid International (LAS) | Ground Stop Programs | low ceilings | – | 03:40 to 04:20 (40 minutes) |
| AUS | Ground Stop Programs | airport volume | – | 19:40 to 20:20 (40 minutes) |
| San Francisco International (SFO) | Ground Delay Programs | LOW; low ceilings | 139 min | 00:00 to 06:40 (6 hours 40 minutes) |
| San Diego International (SAN) | Ground Delay Programs | low visibility; airport volume | 66 min | 01:00 to 22:00 (21 hours) |
| Harry Reid International (LAS) | Ground Delay Programs | low ceilings | 47 min | 00:00 to 03:40 (3 hours 40 minutes) |
| Tampa International (TPA) | General Arrival/Departure Delay Info | WX:Thunderstorms | 121 min | 15:40 to 22:00 (6 hours 20 minutes) |
| Fort Lauderdale-Hollywood International (FLL) | General Arrival/Departure Delay Info | TM Initiatives:MIT:WX | 61 min | 13:40 to 22:00 (8 hours 20 minutes) |
| San Francisco International (SFO) | General Arrival/Departure Delay Info | RWY:Rwy Change – Operational Necessity | 61 min | 17:40 to 22:00 (4 hours 20 minutes) |
| RSW | General Arrival/Departure Delay Info | VOL:Volume | 46 min | 18:20 to 20:00 (1 hour 40 minutes) |
| TEB | General Arrival/Departure Delay Info | VOL:Volume | 31 min | 20:20 to 22:00 (1 hour 40 minutes) |
| Orlando International (MCO) | General Arrival/Departure Delay Info | TM Initiatives:MIT:WX | 31 min | 18:20 to 19:40 (1 hour 20 minutes) |
General arrival and departure delay programmes spanned 12 airports, including Tampa International (TPA), Fort Lauderdale-Hollywood International (FLL), Miami International (MIA), Orlando International (MCO), Denver International (DEN), Seattle-Tacoma International (SEA), and others. The longest such programme lasted 8 hours 20 minutes in FLL caused by traffic management initiatives related to weather. TPA saw six hours 20 minutes of delays due to thunderstorms with a peak average delay of 121 minutes.
Primary Causes of FAA Delay Programmes
The leading cause driving the delay programmes was airport volume, cited in 29 programmes, closely followed by low ceilings causing 27 programmes. Traffic Management initiatives driven by weather impacted 20 programmes, while thunderstorms were explicitly responsible for 18 programmes. Low visibility contributed to 15 programmes, illustrating weather-driven capacity constraints prevalent throughout the day.
At TEB, the five-hour ground stop was triggered solely by airport volume. Ground stops at SAN and LAS resulted from low visibility and low ceilings respectively, while BFI’s ground stop cited other unspecified reasons. Ground delay programmes at SAN and SFO combined
low visibility, airport volume, and low ceilings as causes. General delays often linked to weather phenomena such as thunderstorms and wind interruptions were also prevalent.
Comparison with Previous Days and Averages
Compared with the previous day, November 19, which affected 12 airports with 15 programmes, November 20 saw an increase of two airports and five programmes. The one-week average prior to this date shows 12 airports typically affected, indicating a slightly higher impact on this date. Despite this increase, the situation on November 20 does not represent the worst within the recent tracking window.
Methodology. travelandtournews.com samples the FAA’s National Airspace System status feed every 20
minutes throughout the US operating day and aggregates the result. This report is built from 66 samples taken between 00:00 and 22:00 UTC on 2026-11-20. Durations are the observed window between the first and last sample in which a programme was in force, so a programme’s true length may be slightly longer than shown. Ground stops, ground delay programmes, airport closures and general delays are all published by the FAA in real time; the daily aggregation is ours.