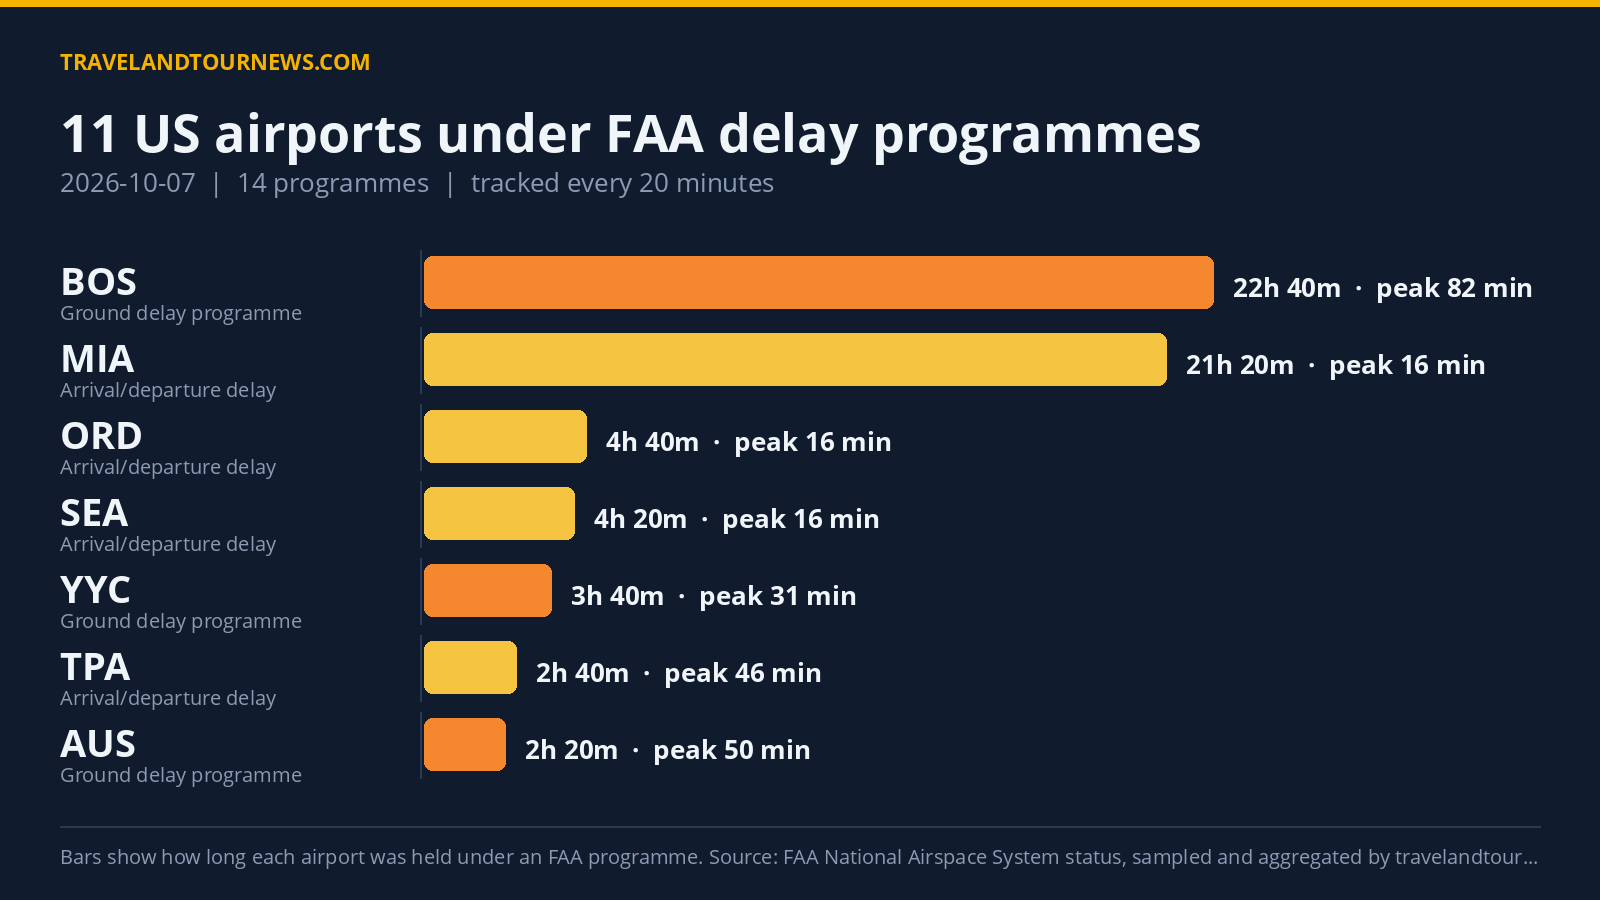

The FAA implemented delay programmes at 11 airports across the United States on October 7, 2026, with a total of 14 programmes active throughout the day. Miami International Airport (MIA) was the worst affected, experiencing a ground stop program lasting 1 hour and 40 minutes due to thunderstorms.
Delay Programmes at Eleven Airports Across the United States
A mix of program types was observed among the affected airports. There were three ground stop programmes—where departures bound for certain airports are held at their point of origin—and three ground delay programmes—where arrival times are metered for incoming flights. The remaining eight were general arrival or departure delay information notices.
Miami International’s ground stop due to thunderstorms was active from 20:00 to 21:40 UTC, spanning 100 minutes, but reported zero peak average or maximum delay minutes during this time. Austin (AUS) also had a ground stop related to runway construction lasting 40 minutes earlier in the day, while Calgary
(YYC) had a 20-minute ground stop for runway maintenance.
Boston Logan International Airport (BOS) had the longest-lasting programme, a ground delay program for runway construction, active for 22 hours and 40 minutes from midnight through late evening, with a peak average delay of 82 minutes and a peak maximum delay of 598 minutes. AUS and YYC also experienced ground delay programmes related to runway construction lasting 2 hours 20 minutes and 3 hours 40 minutes respectively, with peak average delays of 50 and 31 minutes.
| Airport | FAA programme | Cause | Peak average delay | In force (UTC) |
|---|---|---|---|---|
| Miami International (MIA) | Ground Stop Programs | thunderstorms | – | 20:00 to 21:40 (1 hour 40 minutes) |
| AUS | Ground Stop Programs | runway construction | – | 17:40 to 18:20 (40 minutes) |
| YYC | Ground Stop Programs | runway maintenance | – | 18:20 to 18:40 (20 minutes) |
| Boston Logan International (BOS) | Ground Delay Programs | runway construction | 82 min | 00:00 to 22:40 (22 hours 40 minutes) |
| AUS | Ground Delay Programs | runway construction | 50 min | 18:40 to 21:00 (2 hours 20 minutes) |
| YYC | Ground Delay Programs | runway construction | 31 min | 19:00 to 22:40 (3 hours 40 minutes) |
| Tampa International (TPA) | General Arrival/Departure Delay Info | WX:Thunderstorms | 46 min | 20:00 to 22:40 (2 hours 40 minutes) |
| TEB | General Arrival/Departure Delay Info | VOL:Volume | 46 min | 14:40 to 16:20 (1 hour 40 minutes) |
| Miami International (MIA) | General Arrival/Departure Delay Info | TM Initiatives:MIT:WX; RWY:Construction; TM Initiatives:STOP:FREQ OUTAGE | 16 min | 01:20 to 22:40 (21 hours 20 minutes) |
| Chicago O’Hare International (ORD) | General Arrival/Departure Delay Info | VOL:Volume; VOL:Multi-taxi | 16 min | 17:40 to 22:20 (4 hours 40 minutes) |
| Seattle-Tacoma International (SEA) | General Arrival/Departure Delay Info | WX:Low Ceilings | 16 min | 16:00 to 20:20 (4 hours 20 minutes) |
| Fort Lauderdale-Hollywood International (FLL) | General Arrival/Departure Delay Info | TM Initiatives:MIT:WX | 16 min | 12:40 to 12:40 (20 minutes) |
| Dallas/Fort Worth International (DFW) | General Arrival/Departure Delay Info | RWY:Construction | 16 min | 21:00 to 21:00 (20 minutes) |
| Orlando International (MCO) | General Arrival/Departure Delay Info | TM Initiatives:MIT:WX | 16 min | 22:20 to 22:20 (20 minutes) |
Runway Construction and Weather Were Leading Delay Causes
Runway construction accounted for the majority of delay reasons, cited 57 times across programmes, dominating
both ground stop and ground delay types. Thunderstorms and other weather factors were the next most frequent reasons, including nine mentions of thunderstorms and eight of low ceilings classified under weather-related delays.
MIA’s ground stop was specifically triggered by thunderstorms. Tampa International Airport (TPA) also had general delay information citing thunderstorms lasting 2 hours and 40 minutes with peak average delays of 46 minutes. Additional weather-driven delays included Seattle-Tacoma (SEA) facing low ceiling conditions for 4 hours and 20 minutes, with peak average delays of 16 minutes.
Delay Programmes Decline Slightly Compared to Previous Day and Weekly Average
Compared to October 6, 2026, when 12 airports were affected by 16 programmes,
October 7 showed a small decrease with 11 airports and 14 programmes under delay measures. The current day also remained below the seven-day average of 14.1 airports affected. October 7’s delay activities did not represent the worst in the tracked weekly window.
The data reflects all programmes as reported directly by the FAA National Airspace System status feed, sampled every 20 minutes by travelandtournews.com.
Methodology. travelandtournews.com samples the FAA’s National Airspace System status feed every 20 minutes throughout the US operating day and aggregates the result. This report is built from 69 samples taken between 00:00 and 22:40 UTC on
2026-10-07. Durations are the observed window between the first and last sample in which a programme was in force, so a programme’s true length may be slightly longer than shown. Ground stops, ground delay programmes, airport closures and general delays are all published by the FAA in real time; the daily aggregation is ours.