
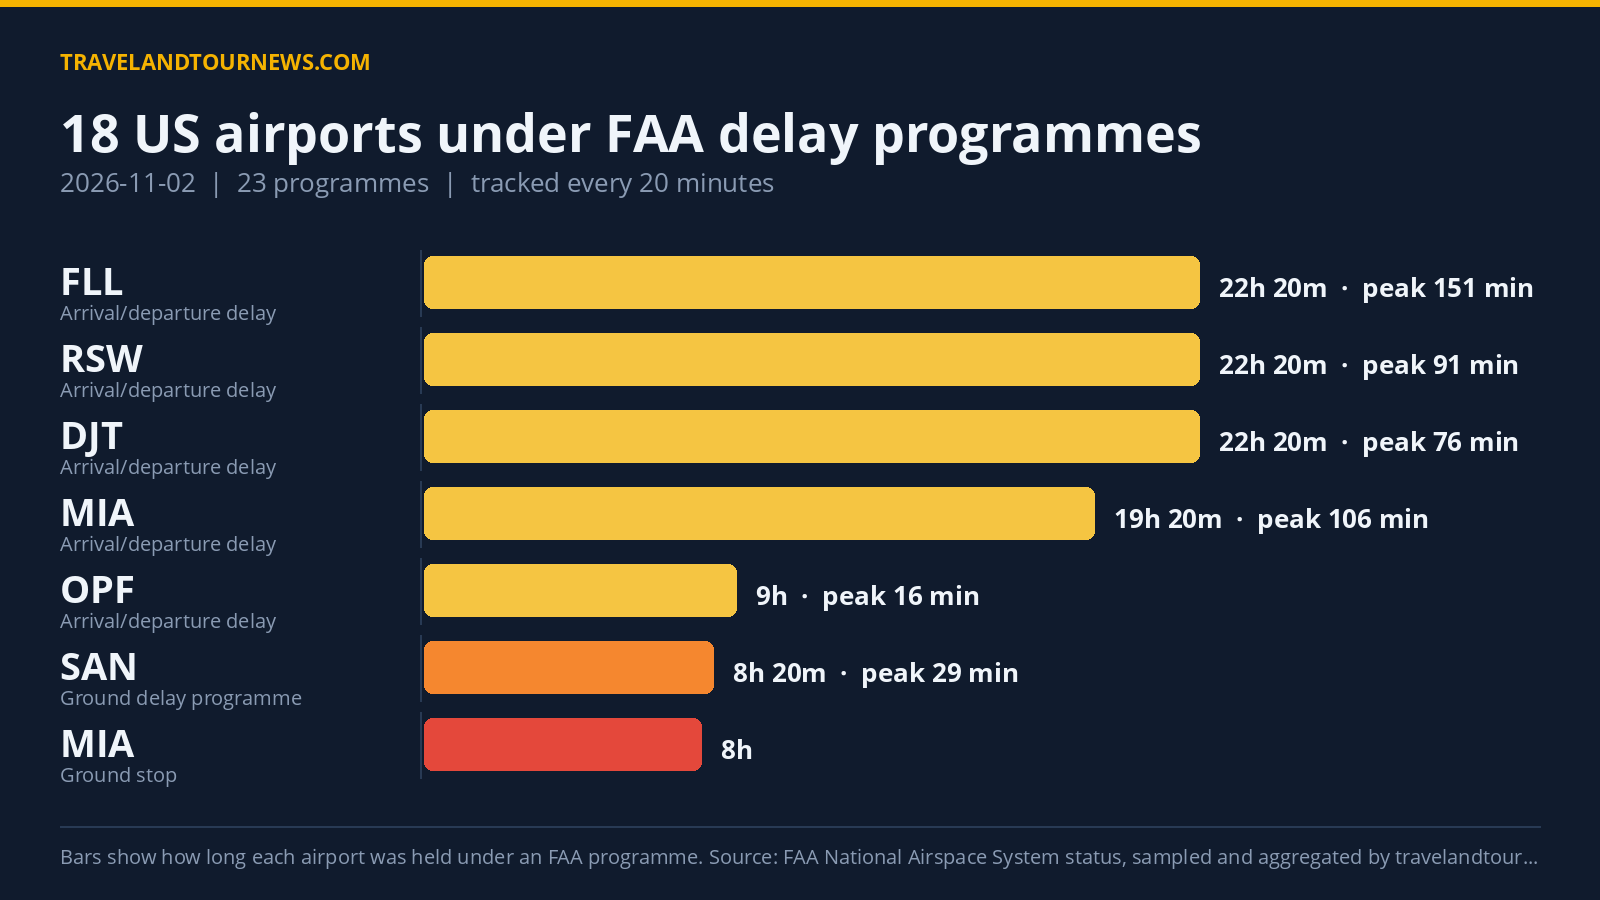

On November 2, 2026, the FAA held 18 United States airports under 23 different delay programs, as tracked by our aggregated feed of the FAA National Airspace System status. Miami International Airport (MIA) was the worst-hit, with delay programs lasting eight hours due to thunderstorms.
Airports Under Delay Programs and Their Durations
Eighteen airports across the United States experienced FAA delay programs on this date. The types of programs included six Ground Stop Programs, which hold departures bound for an airport on the ground at their origin, four Ground Delay Programs, which meter arrivals through assigning later departure times, and thirteen General Arrival/Departure Delay Info entries.
Miami International (MIA) and Fort Lauderdale-Hollywood International (FLL) experienced Ground Stop Programs from 14:20 to 22:20 UTC — an eight-hour span — attributed to thunderstorms. DJT had a ground stop lasting six hours, also related to thunderstorms and other operational reasons. YEG endured a ground stop
for 4 hours and 40 minutes due to fog, while LaGuardia (LGA) experienced a shorter 40-minute ground stop caused by airspace volume. San Francisco (SFO) had a 20-minute ground stop because of staffing constraints.
Ground Delay Programs also affected FLL for 3 hours and 40 minutes, with peak average delay at 107 minutes and a maximum of 309 minutes, driven by thunderstorms. San Diego (SAN) had a ground delay program lasting over eight hours related to airport volume, showing peak average delay of 29 minutes. Harry Reid International (LAS) saw an 80-minute ground delay program caused by wind. SFO also
had a separate one-hour ground delay with a peak average delay of 62 minutes due to other unspecified reasons.
| Airport | FAA programme | Cause | Peak average delay | In force (UTC) |
|---|---|---|---|---|
| Miami International (MIA) | Ground Stop Programs | thunderstorms | – | 14:20 to 22:20 (8 hours) |
| Fort Lauderdale-Hollywood International (FLL) | Ground Stop Programs | thunderstorms; THUNDERSTORMS | – | 14:20 to 22:20 (8 hours) |
| DJT | Ground Stop Programs | thunderstorms; other | – | 14:20 to 20:20 (6 hours) |
| YEG | Ground Stop Programs | fog | – | 00:00 to 04:40 (4 hours 40 minutes) |
| LaGuardia (LGA) | Ground Stop Programs | airspace volume | – | 21:20 to 22:00 (40 minutes) |
| San Francisco International (SFO) | Ground Stop Programs | STAFFING | – | 02:40 to 02:40 (20 minutes) |
| Fort Lauderdale-Hollywood International (FLL) | Ground Delay Programs | thunderstorms | 107 min | 18:40 to 22:20 (3 hours 40 minutes) |
| San Francisco International (SFO) | Ground Delay Programs | other | 62 min | 03:00 to 04:00 (1 hour) |
| Harry Reid International (LAS) | Ground Delay Programs | wind | 49 min | 00:00 to 01:20 (1 hour 20 minutes) |
| San Diego International (SAN) | Ground Delay Programs | airport volume | 29 min | 14:00 to 22:20 (8 hours 20 minutes) |
| Fort Lauderdale-Hollywood International (FLL) | General Arrival/Departure Delay Info | TM Initiatives:MIT:WX | 151 min | 00:00 to 22:20 (22 hours 20 minutes) |
| APF | General Arrival/Departure Delay Info | WX:Thunderstorms | 121 min | 16:00 to 22:20 (6 hours 20 minutes) |
| Miami International (MIA) | General Arrival/Departure Delay Info | TM Initiatives:MIT:WX | 106 min | 00:00 to 19:20 (19 hours 20 minutes) |
| RSW | General Arrival/Departure Delay Info | WX:Thunderstorms | 91 min | 00:00 to 22:20 (22 hours 20 minutes) |
General Arrival/Departure Delay Info programs extended across multiple airports, including a 22-hour 20-minute program at FLL and RSW related to weather mitigation initiatives and thunderstorms. MIA reported a 19-hour 20-minute program driven by traffic management initiatives and weather.
Thunderstorms and Weather Dominated Delay Causes
Thunderstorms were the leading cause of delay programs. FAA data recorded 84 programs citing traffic management initiatives related to weather, labeled as “TM Initiatives:MIT:WX.” Direct thunderstorm mentions accounted for 78 and 51 occurrences under slightly varied descriptions. Other prominent causes included minuscule traffic management weather initiatives at 26 programs and airport volume delays at 24.
Fog was a cause for delays at YEG and Seattle-Tacoma International (SEA). Other weather-related reasons included low ceilings at Chicago O’Hare (ORD) and ASE. Staffing led
to a short delay at San Francisco (SFO), and airspace volume caused delays at LaGuardia (LGA). Phoenix Sky Harbor (PHX) saw a short delay caused by multiple taxi operations.
Increase in Affected Airports Compared to Previous Days
The 18 airports affected on November 2 increased by 6 airports from 12 on the previous day. The total number of delay programs, 23, also rose by 5 from 18 yesterday. This day marked the highest number of affected airports in our 7-day tracking window, where the average is just over 10 airports.
The data underlines heightened delay activity on this date, with multiple airports experiencing extensive delay programs and significant
weather-driven disruptions.
Methodology. travelandtournews.com samples the FAA’s National Airspace System status feed every 20 minutes throughout the US operating day and aggregates the result. This report is built from 66 samples taken between 00:00 and 22:20 UTC on 2026-11-02. Durations are the observed window between the first and last sample in which a programme was in force, so a programme’s true length may be slightly longer than shown. Ground stops, ground delay programmes, airport closures and general delays are all published by the FAA in real time; the daily aggregation is ours.