

On November 9, 2026, the Federal Aviation Administration (FAA) placed 12 airports in the United States under 16 separate delay programmes. The worst-hit airport was San Francisco International Airport (SFO), enduring a ground delay programme with low ceiling conditions resulting in peak delays up to 653 minutes.
Delay Programmes Active at 12 US Airports Including Ground Stops and Closures
The 12 affected airports were Austin (AUS), Boston Logan (BOS), Newark Liberty (EWR), Washington Dulles (IAD), George Bush Intercontinental (IAH), LaGuardia (LGA), Miami (MIA), Chicago O’Hare (ORD), Phoenix Sky Harbor (PHX), San Diego (SAN), Seattle-Tacoma (SEA), and San Francisco (SFO).
Among the 16 programmes recorded, 2 were ground stop programmes—where departures bound for the airport are held at their origin—and 5 ground delay programmes, which meter arrivals by assigning later departure times from the origin airports. There was also 1 airport closure and 8 programmes categorized as general arrival/departure delay information.
San Francisco (SFO) experienced two major delay programmes. Its
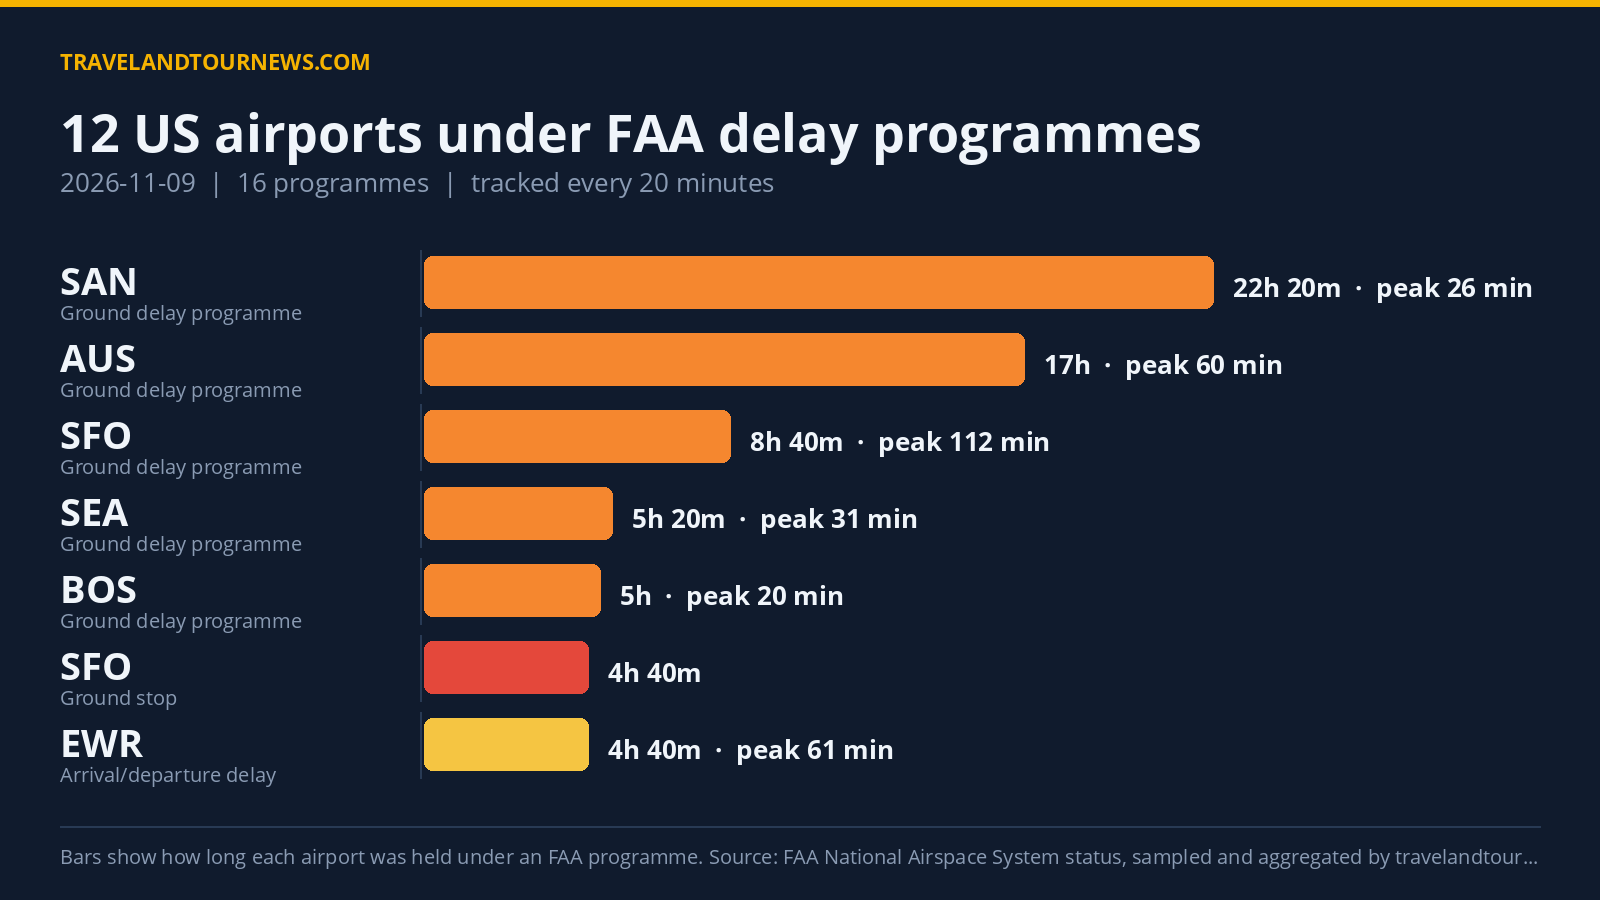
ground delay programme lasted 8 hours and 40 minutes, from 13:40 to 22:20 UTC, with peak average delays of 112 minutes and maximum delays reaching 653 minutes due to low ceilings. SFO also had a separate ground stop programme from 16:20 to 21:00 UTC related to the same cause.
Austin (AUS) had a ground delay programme related to runway construction, active from 00:00 to 17:00 UTC (17 hours), with peak average delays of 60 minutes and maximum of 149 minutes. San Diego (SAN) recorded the longest ongoing delay programme of 22 hours and 20 minutes due to airport volume, peaking
at 26 minutes average delay and 88 minutes maximum. Additionally, SAN was closed for 4 hours and 20 minutes starting at 09:20 UTC.
Seattle-Tacoma (SEA) had a 5-hour and 20-minute ground delay programme classified as “other” and Boston Logan (BOS) had a 5-hour runway construction ground delay programme.
| Airport | FAA programme | Cause | Peak average delay | In force (UTC) |
|---|---|---|---|---|
| San Francisco International (SFO) | Ground Stop Programs | low ceilings | – | 16:20 to 21:00 (4 hours 40 minutes) |
| Washington Dulles International (IAD) | Ground Stop Programs | wind | – | 15:40 to 16:20 (40 minutes) |
| San Francisco International (SFO) | Ground Delay Programs | low ceilings | 112 min | 13:40 to 22:20 (8 hours 40 minutes) |
| AUS | Ground Delay Programs | runway construction | 60 min | 00:00 to 17:00 (17 hours) |
| Seattle-Tacoma International (SEA) | Ground Delay Programs | other | 31 min | 00:00 to 05:20 (5 hours 20 minutes) |
| San Diego International (SAN) | Ground Delay Programs | airport volume | 26 min | 00:00 to 22:20 (22 hours 20 minutes) |
| Boston Logan International (BOS) | Ground Delay Programs | runway construction | 20 min | 16:20 to 21:20 (5 hours) |
| San Diego International (SAN) | Airport Closures | airport closed | – | 09:20 to 13:40 (4 hours 20 minutes) |
| Newark Liberty International (EWR) | General Arrival/Departure Delay Info | STAFF:Staffing | 61 min | 00:40 to 05:20 (4 hours 40 minutes) |
| Miami International (MIA) | General Arrival/Departure Delay Info | RWY:Construction | 31 min | 16:20 to 16:40 (20 minutes) |
| LaGuardia (LGA) | General Arrival/Departure Delay Info | WX:Wind | 16 min | 20:40 to 22:20 (1 hour 40 minutes) |
| San Diego International (SAN) | General Arrival/Departure Delay Info | VOL:Compacted Demand | 16 min | 21:00 to 22:20 (1 hour 20 minutes) |
| Chicago O’Hare International (ORD) | General Arrival/Departure Delay Info | VOL:Multi-taxi | 16 min | 01:20 to 02:00 (40 minutes) |
| San Francisco International (SFO) | General Arrival/Departure Delay Info | VOL:Multi-taxi | 16 min | 01:40 to 01:40 (20 minutes) |
FAA Cites Low Ceilings and Airport Volume as Leading Delay Causes
The FAA’s reported delay causes were led by airport volume and low ceilings, each responsible for 38 samples in the dataset. Runway construction accounted for 25 samples, while airport closures contributed 14 samples. A category marked “other” made up 17 samples.
Low ceilings primarily affected San Francisco (SFO), which accounted for the
longest ground stop and delay programmes related to this cause. Airport volume was the principal cause at San Diego (SAN), which also experienced an extended delay programme and a temporary closure.
Runway construction delayed arrivals at Austin (AUS) and Boston Logan (BOS). Other causes included wind at Washington Dulles (IAD) and general volume congestion effects such as multi-taxi operations at Chicago O’Hare (ORD), Phoenix Sky Harbor (PHX), and briefly at SFO.
Delay Programme Activity Increased Compared to Yesterday but Remained Typical for the Week
Compared to the previous day’s 7 affected airports and 8 programmes, November 9 saw an increase of 5 additional delay programmes and affected 12 airports. The count of airports
affected aligns closely with the seven-day average of 12.3, suggesting the level of delay activity was within typical range for the period.
The day’s longest delay programme was the San Diego volume-related ground delay lasting 22 hours and 20 minutes. Peak average delay across all programmes reached 112 minutes, with a maximum single delay recorded at 653 minutes at SFO.
Data for this report comes from the FAA National Airspace System status feed, aggregated and analyzed by travelandtournews.com.
Methodology. travelandtournews.com samples the FAA’s National Airspace System status feed every 20 minutes throughout the US operating day and aggregates the result.
This report is built from 68 samples taken between 00:00 and 22:20 UTC on 2026-11-09. Durations are the observed window between the first and last sample in which a programme was in force, so a programme’s true length may be slightly longer than shown. Ground stops, ground delay programmes, airport closures and general delays are all published by the FAA in real time; the daily aggregation is ours.