

On November 21, 2026, the FAA held delay programs affecting 18 airports across the United States under a total of 22 programs. The worst-hit airport was San Francisco International (SFO), which experienced peak maximum delays reaching 129 minutes under ground delay programs.
Airports Affected, Program Types, and Delay Durations
The delay programs spanned three categories: four Ground Stop Programs, which hold departures at their origins; seven Ground Delay Programs, which meter arrivals by assigning later departure times; and eleven General Arrival/Departure Delay Information advisories.
Ground Stop Programs were imposed at YOW (Ottawa), YYZ (Toronto Pearson), MIA (Miami International), and AUS (Austin), lasting from 20 minutes to 2 hours 20 minutes. YOW had the longest ground stop duration of 2 hours and 20 minutes due to low visibility but recorded no average or maximum delay minutes during this period. Miami’s ground stop due to thunderstorms lasted 40 minutes. Austin also
experienced a brief 20-minute ground stop due to low ceilings.
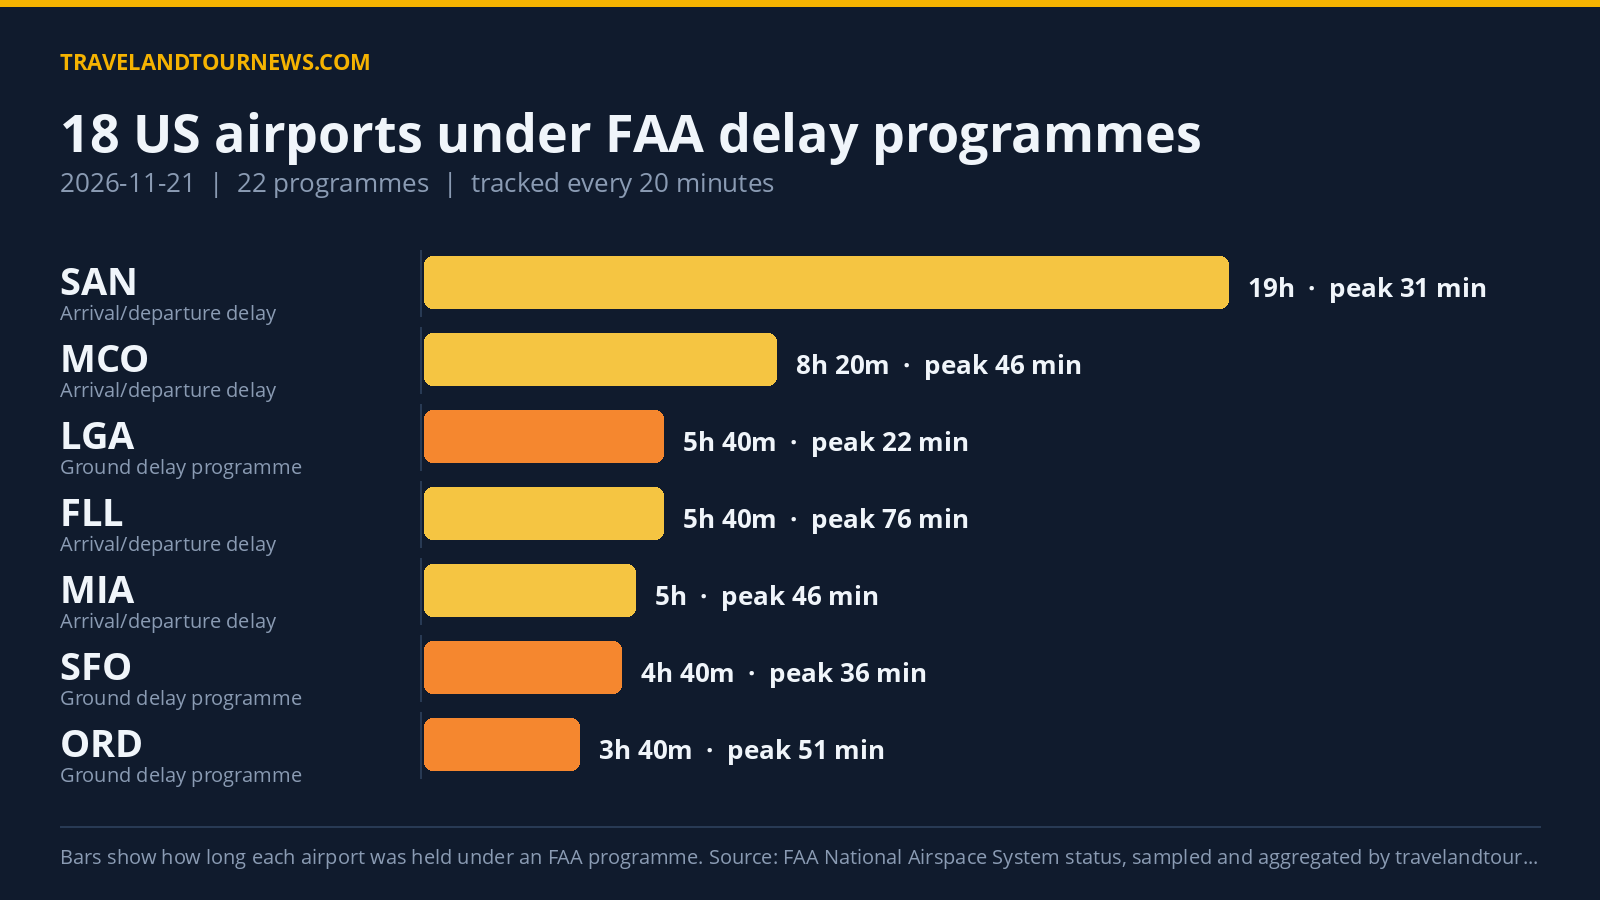
Ground Delay Programs affected airports including Seattle-Tacoma International (SEA), Chicago O’Hare International (ORD), Austin (AUS), San Francisco International (SFO), San Diego International (SAN), LaGuardia (LGA), and Vancouver (YVR). Seattle’s program for runway construction lasted 3 hours with peak average delays of 57 minutes and maximum delays up to 88 minutes. ORD had a 3 hour 40 minute ground delay under an unspecified “other” cause, peaking at 51 average delay minutes and 100 max delay minutes. LGA’s ground delay program related to runway construction lasted 5 hours 40 minutes with peak
average delays of 22 minutes. SFO saw the longest continuous ground delay with 4 hours 40 minutes on low ceilings, with peak maximum delays of 129 minutes. San Diego had ground delays accounting for 2 hours 20 minutes due to airport volume, peaking at 25 average delay minutes.
| Airport | FAA programme | Cause | Peak average delay | In force (UTC) |
|---|---|---|---|---|
| YOW | Ground Stop Programs | low visibility | – | 13:40 to 16:00 (2 hours 20 minutes) |
| YYZ | Ground Stop Programs | low visibility | – | 15:00 to 16:00 (1 hour) |
| Miami International (MIA) | Ground Stop Programs | thunderstorms | – | 19:00 to 19:40 (40 minutes) |
| AUS | Ground Stop Programs | low ceilings | – | 17:00 to 17:00 (20 minutes) |
| Seattle-Tacoma International (SEA) | Ground Delay Programs | runway construction | 57 min | 02:00 to 05:00 (3 hours) |
| Chicago O’Hare International (ORD) | Ground Delay Programs | other | 51 min | 00:20 to 04:00 (3 hours 40 minutes) |
| AUS | Ground Delay Programs | runway construction | 43 min | 13:00 to 13:00 (20 minutes) |
| San Francisco International (SFO) | Ground Delay Programs | low ceilings | 36 min | 14:00 to 18:40 (4 hours 40 minutes) |
| San Diego International (SAN) | Ground Delay Programs | airport volume | 25 min | 00:00 to 02:20 (2 hours 20 minutes) |
| LaGuardia (LGA) | Ground Delay Programs | runway construction | 22 min | 12:00 to 17:40 (5 hours 40 minutes) |
| YVR | Ground Delay Programs | airport volume | 20 min | 17:40 to 19:20 (1 hour 40 minutes) |
| RSW | General Arrival/Departure Delay Info | WX:Thunderstorms; VOL:Volume | 91 min | 18:40 to 22:00 (3 hours 20 minutes) |
| Fort Lauderdale-Hollywood International (FLL) | General Arrival/Departure Delay Info | TM Initiatives:MIT:WX | 76 min | 16:20 to 22:00 (5 hours 40 minutes) |
| FMY | General Arrival/Departure Delay Info | WX:Thunderstorms | 61 min | 19:00 to 22:00 (3 hours) |
General Arrival/Departure Delay Information covered major hubs such as Fort Lauderdale-Hollywood International (FLL), Orlando International (MCO), Tampa International (TPA), Miami International (MIA), and Denver International (DEN). Fort Lauderdale experienced 5 hours 40 minutes of delays related to FAA Traffic Management Initiatives addressing weather, with peak average delays of 76 minutes and max delays of 90 minutes. Orlando’s advisories combined weather and volume control measures over 8 hours 20 minutes with delays under 46 average minutes at peak. Tampa’s delays lasted 2 hours 40 minutes, caused by thunderstorms, peaking at 46 minutes average delay.
Delay Causes with Weather and Construction Leading
FAA data tracked by travelandtournews.com shows the top five causes for delay programs on November 21. The most common was Traffic Management Initiatives related to weather (TM Initiatives:MIT:WX), responsible for 36 programs. Runway construction accounted for 29 programs, and thunderstorms were cited in 22 programs. Volume-related causes composed two categories that together
accounted for 32 programs: Compacted Demand (16) and general Airport Volume (16). Low ceilings also appeared in 16 programs, often linked with ground delays.
Specifically, low visibility caused ground stop programs at Canadian airports YOW and YYZ. Thunderstorms impacted Miami’s ground stop and general delay advisories at multiple Florida airports including RSW and FMY. Runway construction was a major factor at Seattle, Austin, and LaGuardia, among others.
Comparison to Yesterday and Recent Average
Compared with November 20, when 14 airports were affected under 20 programs, November 21 showed an increase with 18 affected airports and 22 programs. This marks a rise of 4 airports and 2
programs from the previous day. The daily airport count also surpasses the recent seven-day average of 10.9 airports affected. This day’s delays represent the highest airport count in the tracking window.
Methodology. travelandtournews.com samples the FAA’s National Airspace System status feed every 20 minutes throughout the US operating day and aggregates the result. This report is built from 67 samples taken between 00:00 and 22:00 UTC on 2026-11-21. Durations are the observed window between the first and last sample in which a programme was in force, so a programme’s true length may be slightly longer than shown. Ground stops, ground
delay programmes, airport closures and general delays are all published by the FAA in real time; the daily aggregation is ours.