
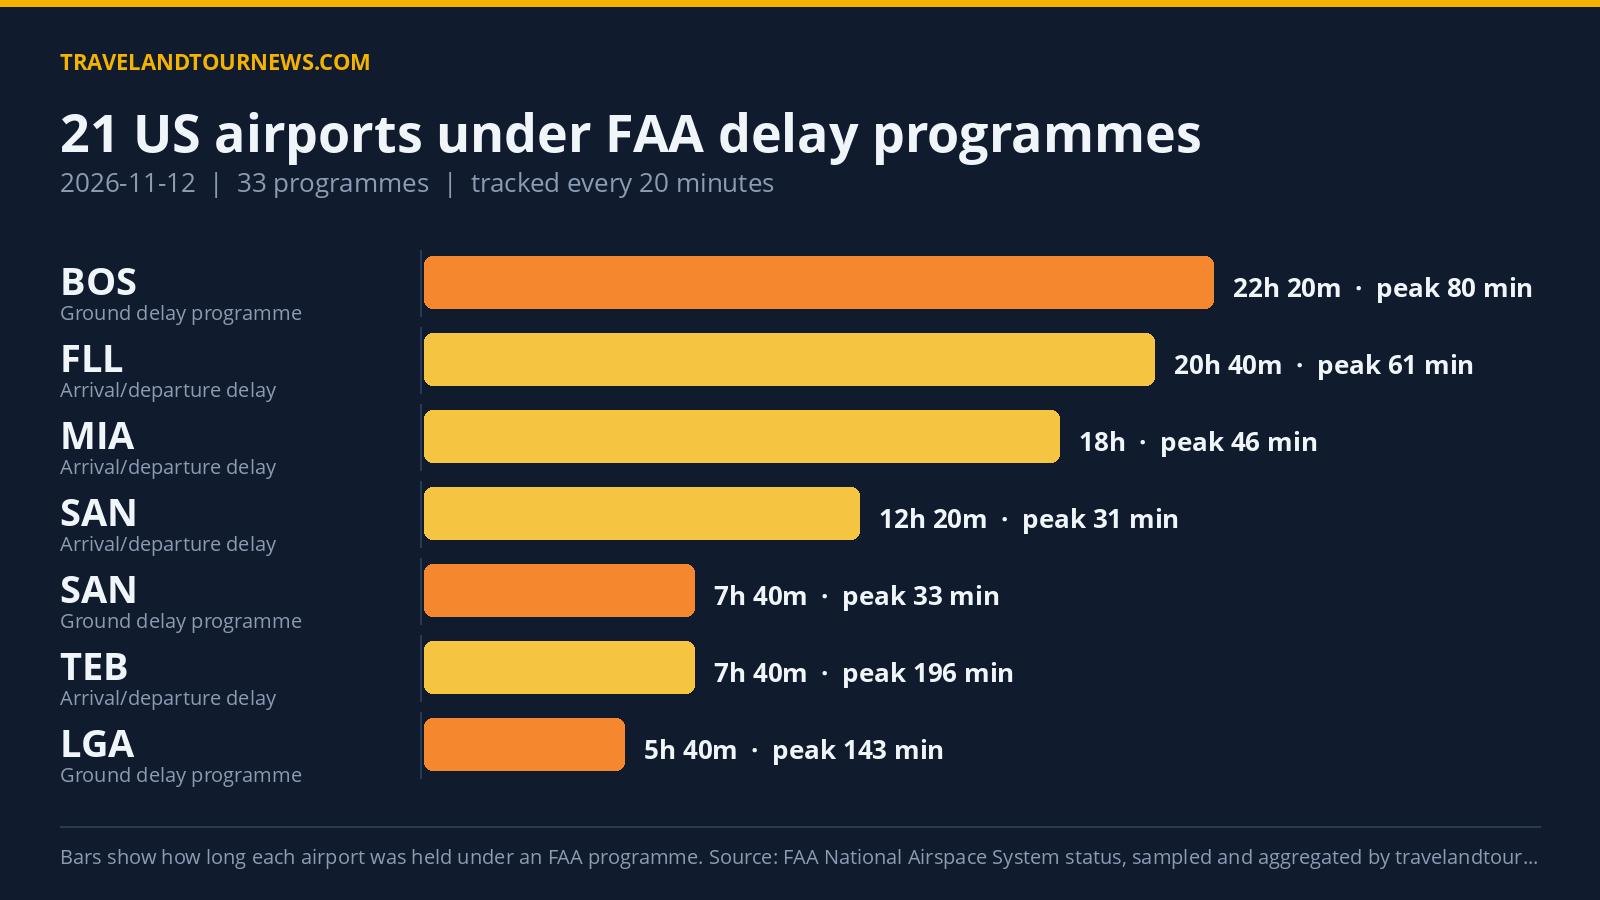

On November 12, 2026, the FAA held 21 US airports under 33 delay programmes, marking a significant disruption across the country. LaGuardia Airport (LGA) was the worst-hit airport with a peak maximum delay reaching 381 minutes.
Airports and Delay Programmes in Effect
Of the 33 programmes recorded between 00:00 and 22:20 UTC, 10 were Ground Stop Programs, which hold departures bound for the airport on the ground at their origin, and 6 were Ground Delay Programs, which assign later departure times to meter arrivals. The remaining 17 programmes were general arrival/departure delay information advisories without formal restrictions.
Ground Stop Programs prominently affected the New York metropolitan area. LaGuardia (LGA), Newark Liberty International (EWR), John F. Kennedy International (JFK), Philadelphia International (PHL), Boston Logan International (BOS), Teterboro (TEB), Morristown (MMU), and Washington Dulles International (IAD) were under ground stops due to thunderstorms lasting
from as early as 16:20 UTC up to 22:20 UTC, with durations ranging from 1 hour at IAD to nearly 5 hours at LGA. Seattle-Tacoma (SEA) and San Antonio International (SAT) experienced ground stops for airport volume lasting 40 minutes and 20 minutes, respectively.
| Airport | FAA programme | Cause | Peak average delay | In force (UTC) |
|---|---|---|---|---|
| LaGuardia (LGA) | Ground Stop Programs | thunderstorms | – | 17:40 to 22:20 (4 hours 40 minutes) |
| Newark Liberty International (EWR) | Ground Stop Programs | thunderstorms | – | 17:40 to 22:20 (4 hours 40 minutes) |
| John F. Kennedy International (JFK) | Ground Stop Programs | thunderstorms | – | 18:00 to 22:20 (4 hours 20 minutes) |
| Philadelphia International (PHL) | Ground Stop Programs | thunderstorms | – | 18:20 to 22:00 (3 hours 40 minutes) |
| Boston Logan International (BOS) | Ground Stop Programs | thunderstorms | – | 19:00 to 22:20 (3 hours 20 minutes) |
| TEB | Ground Stop Programs | thunderstorms | – | 19:20 to 22:20 (3 hours) |
| MMU | Ground Stop Programs | thunderstorms | – | 19:20 to 22:20 (3 hours) |
| Washington Dulles International (IAD) | Ground Stop Programs | thunderstorms | – | 20:00 to 21:00 (1 hour) |
| Seattle-Tacoma International (SEA) | Ground Stop Programs | airport volume | – | 16:20 to 17:00 (40 minutes) |
| San Antonio International (SAT) | Ground Stop Programs | airport volume | – | 21:20 to 21:40 (20 minutes) |
| John F. Kennedy International (JFK) | Ground Delay Programs | thunderstorms | 246 min | 21:00 to 22:20 (1 hour 20 minutes) |
| Newark Liberty International (EWR) | Ground Delay Programs | thunderstorms | 187 min | 20:00 to 22:20 (2 hours 20 minutes) |
| LaGuardia (LGA) | Ground Delay Programs | thunderstorms | 143 min | 16:40 to 22:20 (5 hours 40 minutes) |
| Boston Logan International (BOS) | Ground Delay Programs | runway construction; low ceilings | 80 min | 00:00 to 22:20 (22 hours 20 minutes) |
Ground Delay Programs lasted longest at Boston Logan (BOS), where runway construction combined with low ceilings extended operations for 22 hours and 20 minutes, producing peak average delays of 80 minutes and maximum delays of 186 minutes. LaGuardia’s ground delay programme following thunderstorms spanned 5 hours and 40 minutes, with peak average delays of 143 minutes and maximum delays of 381 minutes.
Major hubs like JFK and Newark Liberty also experienced ground delay programs due to thunderstorms, with JFK’s lasting 1 hour and 20 minutes and peak maximum delays of 500 minutes, while Newark’s ground delay extended for 2 hours and 20 minutes with a peak maximum delay of 508 minutes.
Seattle-Tacoma had a ground delay programme for
five hours and 20 minutes under unspecified causes, designated as “other” by the FAA, with peak maximum delays of 82 minutes.
Thunderstorms and Traffic Management Drive Delays
The primary cause driving these delay programs was thunderstorms, triggering 114 distinct delay episodes. FAA traffic management initiatives related to weather, labeled TM Initiatives:SWAP:WX and TM Initiatives:MIT:WX, accounted for 57 and 51 delay samples respectively. Low ceilings and airport volume contributed to 31 and 29 delay episodes.
Thunderstorm-related ground stops affected many northeast airports including LGA, EWR, JFK, PHL, BOS, MMU, and TEB. The New York area especially saw compounding delays from these weather events causing both ground stops
and ground delay programmes.
Airport volume was a significant cause at San Diego (SAN), Seattle-Tacoma (SEA), and San Antonio (SAT), while Boston’s extended ground delay programme was influenced by runway construction and low ceilings.
Delays Intensify from Yesterday and Exceed Weekly Average
The count of airports affected today, 21, is 10 more than the 11 recorded yesterday and also above the weekly average of 10.7 airports. Total programmes rose sharply from 15 yesterday to 33 today, indicating elevated air traffic disruption. November 12, 2026, is the worst day in this seven-day window tracked by travelandtournews.com from FAA data.
Methodology. travelandtournews.com samples the FAA’s National Airspace System status feed
every 20 minutes throughout the US operating day and aggregates the result. This report is built from 68 samples taken between 00:00 and 22:20 UTC on 2026-11-12. Durations are the observed window between the first and last sample in which a programme was in force, so a programme’s true length may be slightly longer than shown. Ground stops, ground delay programmes, airport closures and general delays are all published by the FAA in real time; the daily aggregation is ours.