
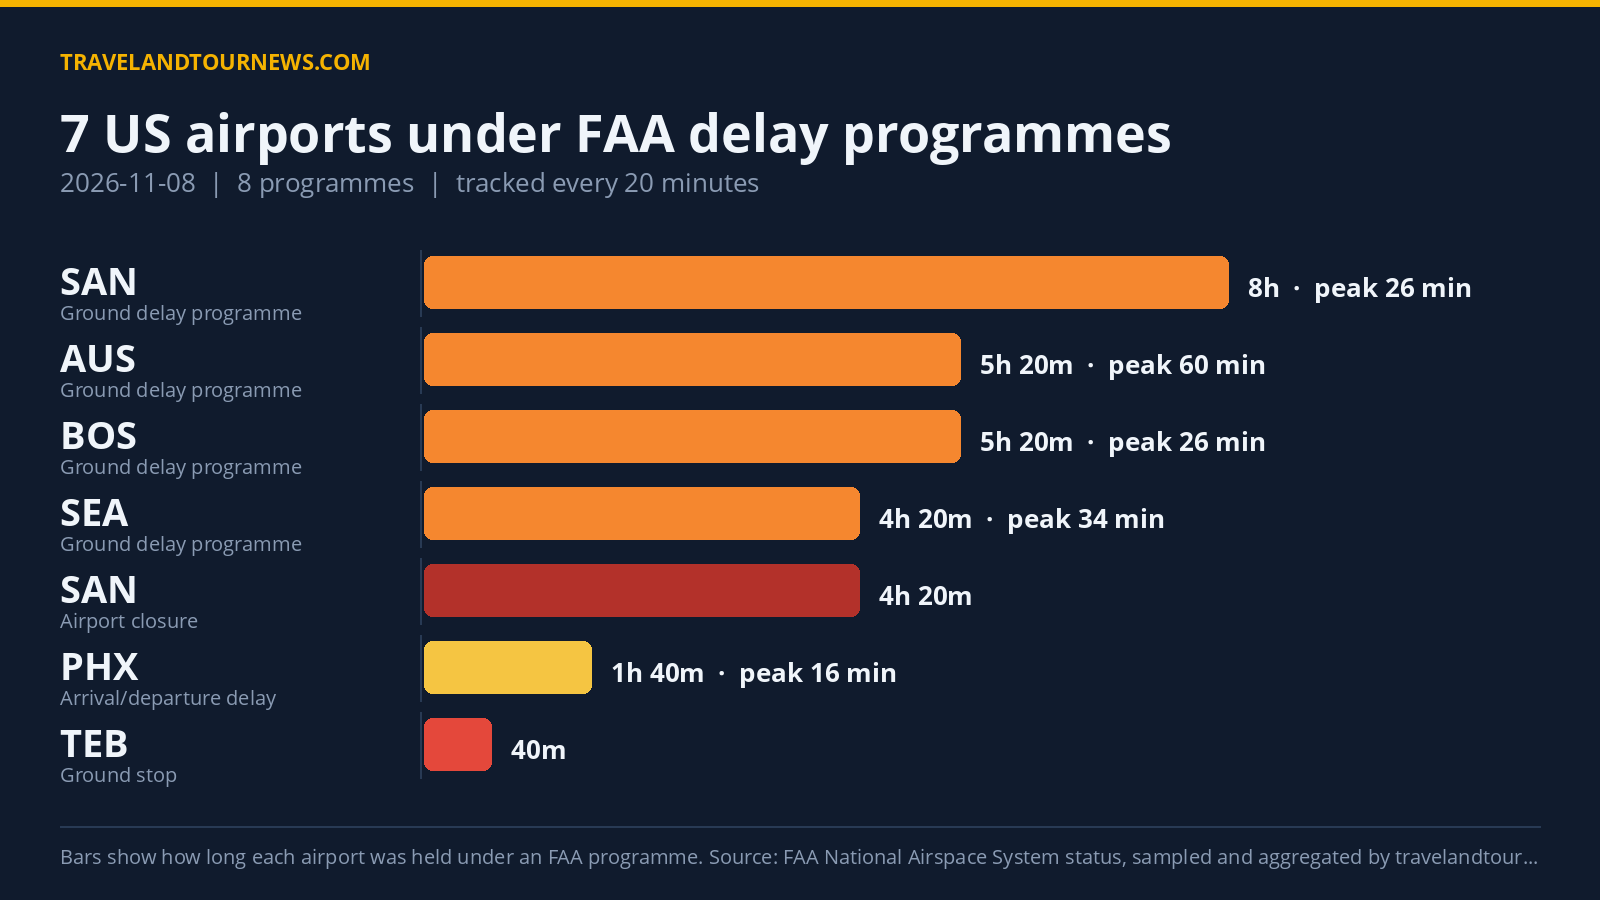

On November 8, 2026, the FAA monitored eight delay programs affecting seven U.S. airports. The worst-hit airport was Seattle-Tacoma International (SEA), with a peak maximum delay reaching 173 minutes according to FAA data tracked by travelandtournews.com.
FAA Programs at Seven Airports Including Ground Stops and Delays
Among the seven airports with FAA delay notices, San Diego International (SAN), Seattle-Tacoma International (SEA), Boston Logan International (BOS), Austin-Bergstrom International (AUS), Teterboro Airport (TEB), Phoenix Sky Harbor International (PHX), and OPF were affected by various delay programs. There was one ground stop program at TEB, which holds departures bound for the airport at their origin. Four ground delay programs meter arrivals by assigning later departure times at AUS, BOS, SEA, and SAN. San Diego International also faced an airport closure. PHX and OPF observed general arrival/departure delay information programs.
San Diego International experienced the longest ground delay program, lasting
8 hours from 14:20 to 22:20 UTC, with peak delays averaging 26 minutes and a maximum of 88 minutes. Austin-Bergstrom’s ground delay program lasted 5 hours 20 minutes with an average peak delay of 60 minutes and a maximum of 149 minutes. Boston Logan’s program also ran for 5 hours 20 minutes with a peak average delay of 26 minutes and maximum delay of 83 minutes. Seattle-Tacoma’s program lasted 4 hours 20 minutes yielding an average of 34 minutes delay and a maximum of 173 minutes, the highest peak delay observed. The ground stop at TEB lasted 40 minutes but
recorded no delay minutes during the observed period.
| Airport | FAA programme | Cause | Peak average delay | In force (UTC) |
|---|---|---|---|---|
| TEB | Ground Stop Programs | airspace volume | – | 21:40 to 22:20 (40 minutes) |
| AUS | Ground Delay Programs | runway construction | 60 min | 17:00 to 22:20 (5 hours 20 minutes) |
| Seattle-Tacoma International (SEA) | Ground Delay Programs | wind | 34 min | 00:00 to 04:20 (4 hours 20 minutes) |
| San Diego International (SAN) | Ground Delay Programs | airport volume | 26 min | 14:20 to 22:20 (8 hours) |
| Boston Logan International (BOS) | Ground Delay Programs | runway construction | 26 min | 16:40 to 22:00 (5 hours 20 minutes) |
| San Diego International (SAN) | Airport Closures | airport closed | – | 09:20 to 13:40 (4 hours 20 minutes) |
| Phoenix Sky Harbor International (PHX) | General Arrival/Departure Delay Info | VOL:Multi-taxi | 16 min | 17:20 to 19:00 (1 hour 40 minutes) |
| OPF | General Arrival/Departure Delay Info | VOL:Volume | 16 min | 22:20 to 22:20 (20 minutes) |
Runway Construction and Airport Volume Drove Most Delays
FAA data shows runway construction was the leading cause, triggering 34 delay program samples. Airport volume was the second most frequent reason, cited 25 times across the day’s programs. Wind was responsible for delays during SEA’s ground delay program, appearing in 14 samples. The airport closure at SAN accounted for another 14 samples. Miscellaneous volume-related reasons such as multi-taxi delays appeared less frequently. The specific cause for the ground stop at TEB was classified as airspace volume.
Fall in Delays from Previous Day; Below Weekly Average
The total of seven affected airports and eight programs represents a notable decrease compared to
yesterday’s 12 airports and 18 programs. The drop of five programs indicates reduced impact relative to the day before. The count also falls below the seven-day average of 13 airports affected. Today’s delay levels were not the highest recorded in the recent week.
Methodology. travelandtournews.com samples the FAA’s National Airspace System status feed every 20 minutes throughout the US operating day and aggregates the result. This report is built from 68 samples taken between 00:00 and 22:20 UTC on 2026-11-08. Durations are the observed window between the first and last sample in which a programme was in force, so a
programme’s true length may be slightly longer than shown. Ground stops, ground delay programmes, airport closures and general delays are all published by the FAA in real time; the daily aggregation is ours.