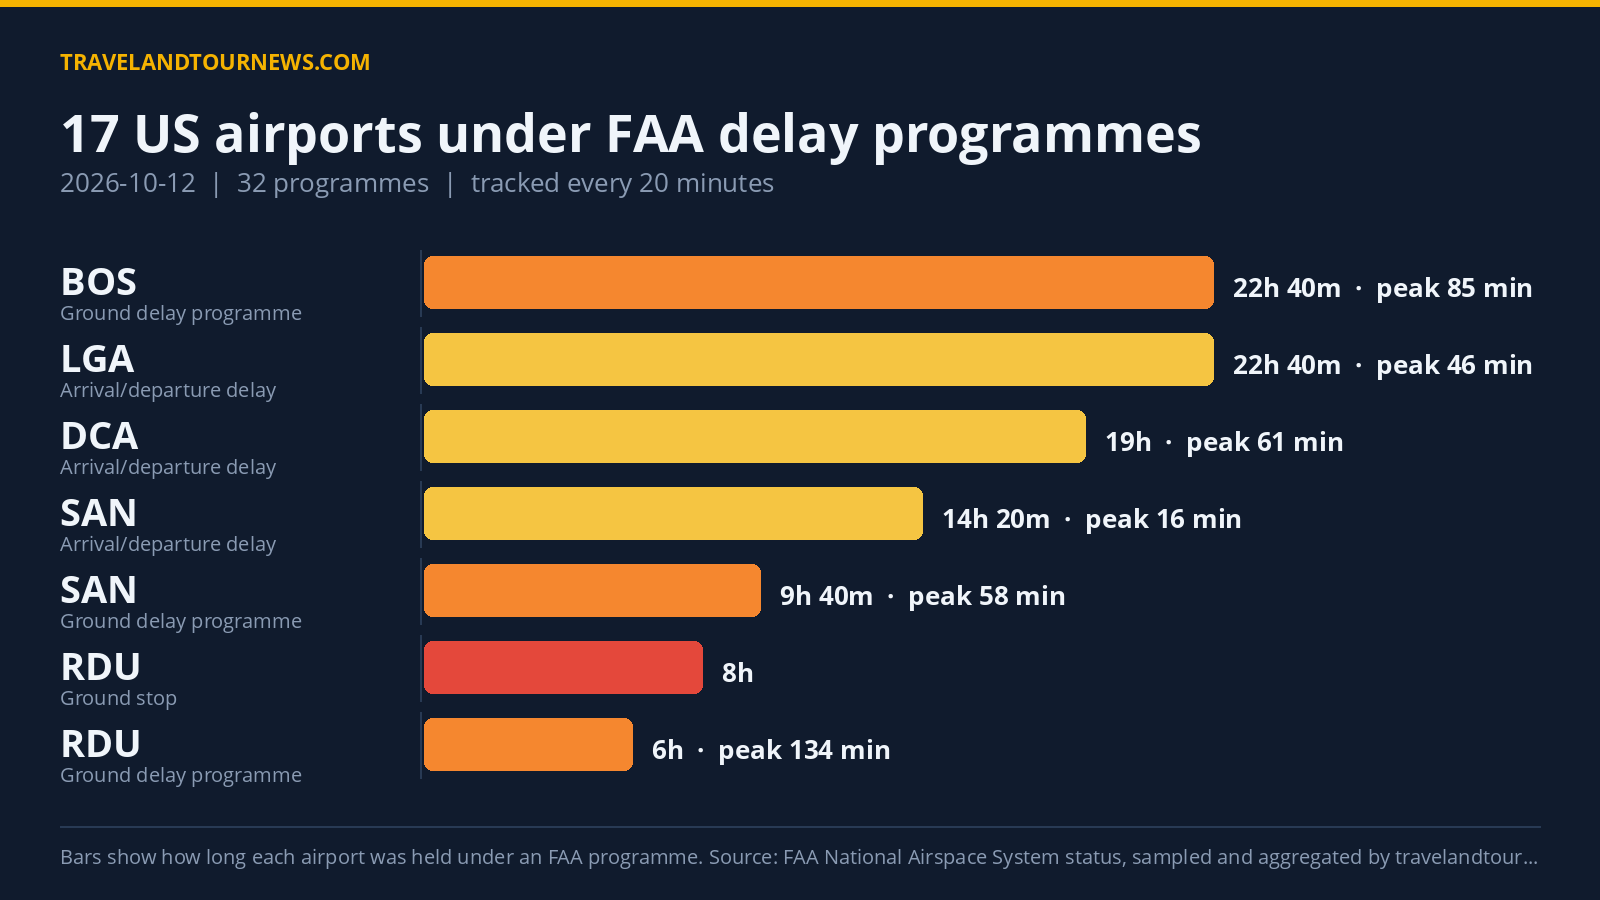

On October 12, 2026, the FAA implemented 32 delay programs affecting 17 airports across the United States. Raleigh-Durham International Airport (RDU) was the worst hit, with ground stop programs related to an equipment outage lasting 8 hours and extending delays up to 356 minutes.
Detailed Airport Delay Programs and Their Durations
The 17 affected airports were subject to a mix of delay program types: nine ground stop programs, eleven ground delay programs, one airport closure, and eleven general arrival/departure delay notices. A ground stop holds departures bound for an airport on the ground at their origin; a ground delay program meters arrivals with assigned later departure times.
RDU experienced two types of programs: a ground stop lasting 8 hours with an equipment outage reason, and a ground delay program spanning 6 hours with peak average delays reaching 134 minutes and maximum delays hitting 356 minutes.
Boston Logan International (BOS) saw the
longest single program, a ground delay program lasting 22 hours and 40 minutes, citing runway construction and low ceilings as causes. BOS’s peak average delay reached 85 minutes with a maximum of 387 minutes.
San Diego International (SAN) had a ground delay program lasting nearly 10 hours for airport volume and an airport closure of 4 hours 20 minutes. Other airports such as Denver International (DEN) and San Francisco (SFO) faced delays primarily due to runway construction lasting between 40 minutes to nearly 5 hours.
Airports like JFK, LaGuardia (LGA), and Ronald Reagan Washington National (DCA) saw multiple programs largely
due to low ceilings, wind, and thunderstorms with delays ranging from 20 minutes in ground stop programs to over 3 hours in delay programs.
| Airport | FAA programme | Cause | Peak average delay | In force (UTC) |
|---|---|---|---|---|
| Raleigh-Durham International (RDU) | Ground Stop Programs | equipment outage | – | 14:40 to 22:40 (8 hours) |
| Harry Reid International (LAS) | Ground Stop Programs | airspace volume; thunderstorms | – | 21:40 to 22:40 (1 hour) |
| San Diego International (SAN) | Ground Stop Programs | airport volume | – | 02:20 to 03:00 (40 minutes) |
| Denver International (DEN) | Ground Stop Programs | runway construction | – | 14:20 to 15:00 (40 minutes) |
| AUS | Ground Stop Programs | wind | – | 17:40 to 18:20 (40 minutes) |
| Boston Logan International (BOS) | Ground Stop Programs | low ceilings; LOW | – | 21:20 to 22:00 (40 minutes) |
| John F. Kennedy International (JFK) | Ground Stop Programs | low ceilings | – | 00:20 to 00:40 (20 minutes) |
| LaGuardia (LGA) | Ground Stop Programs | wind | – | 12:40 to 13:00 (20 minutes) |
| Phoenix Sky Harbor International (PHX) | Ground Stop Programs | thunderstorms | – | 18:20 to 18:20 (20 minutes) |
| John F. Kennedy International (JFK) | Ground Delay Programs | low ceilings | 151 min | 00:00 to 03:20 (3 hours 20 minutes) |
| Raleigh-Durham International (RDU) | Ground Delay Programs | equipment outage | 134 min | 16:40 to 22:40 (6 hours) |
| Boston Logan International (BOS) | Ground Delay Programs | RWY; low ceilings | 85 min | 00:00 to 22:40 (22 hours 40 minutes) |
| Newark Liberty International (EWR) | Ground Delay Programs | low ceilings | 80 min | 00:00 to 02:40 (2 hours 40 minutes) |
| Philadelphia International (PHL) | Ground Delay Programs | low ceilings | 66 min | 00:00 to 00:40 (40 minutes) |
Top Causes of Delay Programs
Analyzing all programs, the leading cause was low ceilings, cited in 79 instances. Airport volume and equipment outages both contributed to 33 delay programs each. Weather-related low ceilings specifically affected 27 programs, while runway construction caused 25 programs.
Several airports reported unique causes: equipment outage exclusively impacted RDU, thunderstorms affected LAS and PHX, and wind was a factor in delays at AUS and LGA. Boston’s long-running delay program combined runway construction and low ceilings.
Comparison With Previous Day And Weekly Average
Compared to
October 11, 2026, when 18 airports were affected by 32 programs, October 12 saw a slight decrease to 17 airports affected with the same number of programs. The number of airports impacted was also above the seven-day average of 15.4 airports.
The consistency of delay programs on these days indicates persistent operational challenges, but October 12 was not the worst in the week-long tracking window.
Methodology. travelandtournews.com samples the FAA’s National Airspace System status feed every 20 minutes throughout the US operating day and aggregates the result. This report is built from 69 samples taken between 00:00 and 22:40 UTC
on 2026-10-12. Durations are the observed window between the first and last sample in which a programme was in force, so a programme’s true length may be slightly longer than shown. Ground stops, ground delay programmes, airport closures and general delays are all published by the FAA in real time; the daily aggregation is ours.