
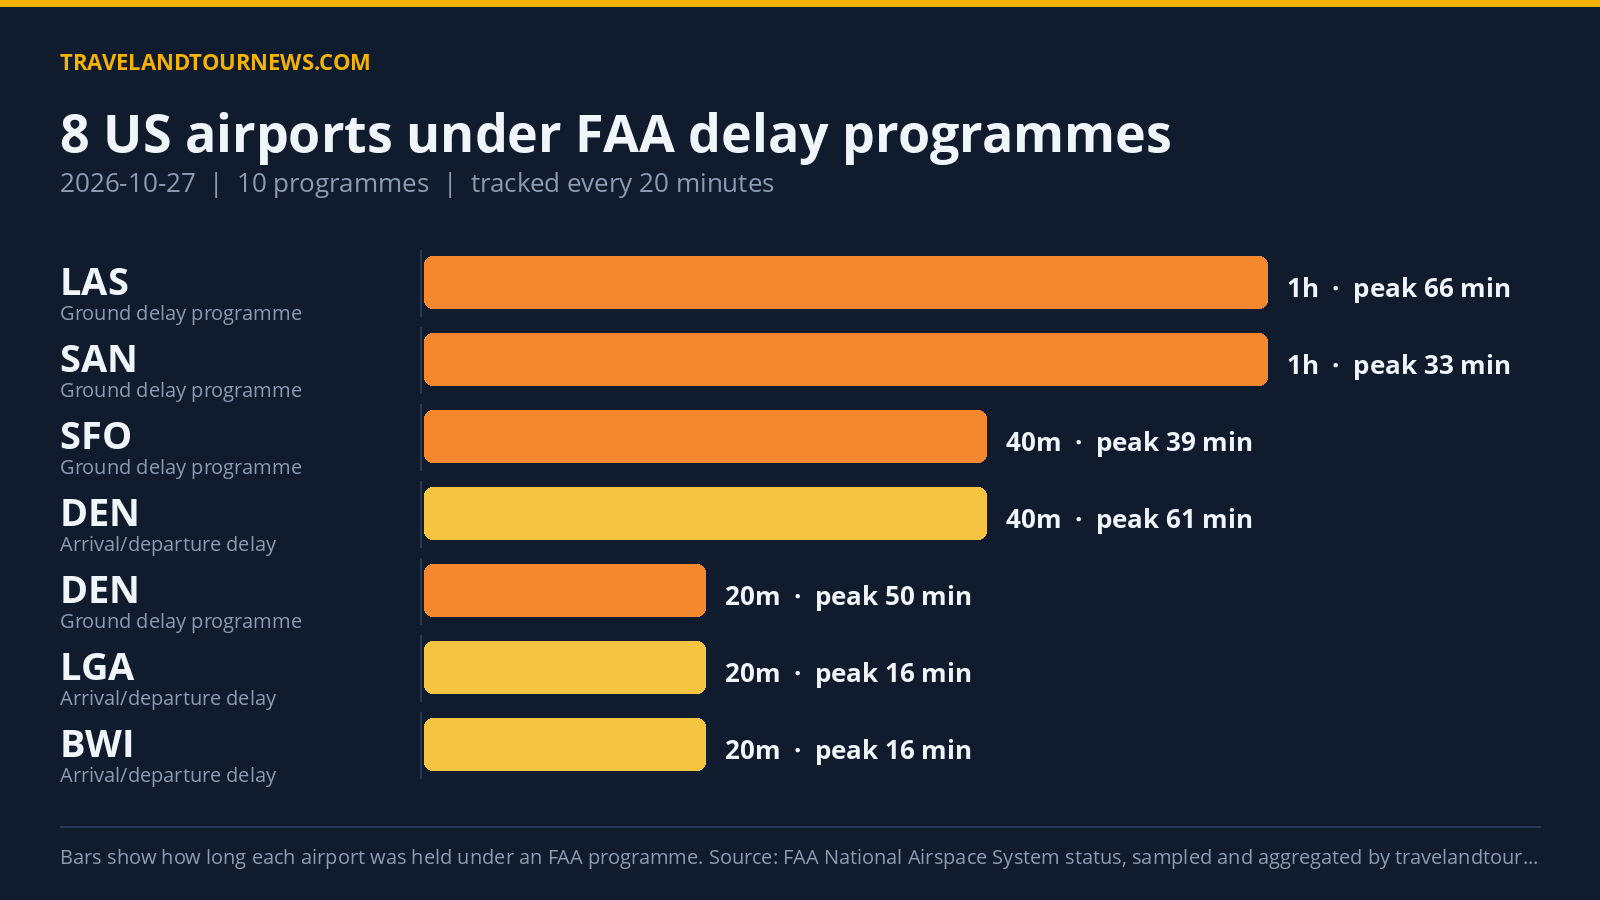

On October 27, 2026, the FAA held 8 US airports under a total of 10 delay programmes, with Harry Reid International Airport (LAS) recording the worst peak delay of 128 minutes under a ground delay programme.
Delay Programmes Across Eight US Airports on October 27
The affected airports were Baltimore/Washington International (BWI), Denver International (DEN), Fort Lauderdale-Hollywood International (FLL), Harry Reid International (LAS), LaGuardia (LGA), Phoenix Sky Harbor International (PHX), San Diego International (SAN), and San Francisco International (SFO).
Among the 10 total programmes, 4 were ground delay programmes, which meter arrivals by assigning later departure times, and the other 6 were general arrival/departure delay information updates. No ground stops, which hold departures at their origin, were recorded.
Harry Reid International (LAS) was the most impacted, having a ground delay programme in force for one hour from 00:00 to 01:00 UTC. During this time, the
airport saw a peak average delay of 66 minutes and a peak maximum delay of 128 minutes due to unspecified causes labeled as “other.”
| Airport | FAA programme | Cause | Peak average delay | In force (UTC) |
|---|---|---|---|---|
| Harry Reid International (LAS) | Ground Delay Programs | other | 66 min | 00:00 to 01:00 (1 hour) |
| Denver International (DEN) | Ground Delay Programs | other | 50 min | 06:20 to 06:40 (20 minutes) |
| San Francisco International (SFO) | Ground Delay Programs | low ceilings | 39 min | 13:20 to 14:00 (40 minutes) |
| San Diego International (SAN) | Ground Delay Programs | airport volume | 33 min | 00:00 to 01:00 (1 hour) |
| Denver International (DEN) | General Arrival/Departure Delay Info | ZDV / WX:Fog | 61 min | 13:20 to 14:00 (40 minutes) |
| LaGuardia (LGA) | General Arrival/Departure Delay Info | VOL:Compacted Demand | 16 min | 01:00 to 01:20 (20 minutes) |
| Baltimore/Washington International (BWI) | General Arrival/Departure Delay Info | RWY:Maintenance | 16 min | 18:20 to 18:20 (20 minutes) |
| Fort Lauderdale-Hollywood International (FLL) | General Arrival/Departure Delay Info | TM Initiatives:MIT:VOL | 16 min | 18:20 to 18:20 (20 minutes) |
| Phoenix Sky Harbor International (PHX) | General Arrival/Departure Delay Info | VOL:Multi-taxi | 16 min | 18:20 to 18:20 (20 minutes) |
| San Francisco International (SFO) | General Arrival/Departure Delay Info | WX:Low Ceilings | 16 min | 18:20 to 18:20 (20 minutes) |
San Diego International (SAN) also had a one-hour ground delay programme (00:00–01:00 UTC) driven by airport volume, with peak delays of 33 minutes on average and a maximum of 72 minutes. San Francisco International (SFO) experienced a 40-minute ground delay programme (13:20–14:00 UTC) caused by low ceilings, peaking at an average delay of 39 minutes and a maximum of 103 minutes.
Denver International (DEN) had two delay programmes: a two-sample ground delay programme (06:20–06:40 UTC) attributed to “other” causes with peak delays averaging 50 minutes and maxing at 135 minutes; and a three-sample general arrival/departure delay info update (13:20–14:00 UTC) due to fog, showing peak average delays of 61 minutes and a max of 75 minutes.
The remaining airports—LaGuardia (LGA), Baltimore/Washington International (BWI), Fort Lauderdale-Hollywood International (FLL), Phoenix Sky Harbor International (PHX), and San Francisco International (SFO)—each
had brief general arrival/departure delay info updates lasting 20 minutes. Their peak average delays were mostly 16 minutes, with maximum delays reaching up to 30 minutes. Causes included compacted demand at LGA, runway maintenance at BWI, management initiatives at FLL, multi-taxi volume at PHX, and low ceilings at SFO.
Top Causes Were Mostly Unspecified ‘Other’ and Airport Volume
Analysis of FAA’s stated reasons shows the most frequent cause category was “other,” cited in 6 programmes. The second most common cause was airport volume, appearing in 4 programmes. Weather-related factors such as low ceilings and fog conditions in the Denver center area each affected 3 programmes, while compacted demand accounted
for 2 programmes.
Specific causes included runway maintenance, volume effects like multi-taxi operations, and traffic management initiatives but these affected only single programmes each.
Decrease in Programmes Compared to Previous Day and Weekly Average
Compared with October 26, 2026, which saw 13 affected airports and 15 delay programmes, October 27 showed a reduction by 5 programmes and 5 fewer airports under delay programmes. The daily total programmes also fell below the seven-day average of 11.3 airports affected.
Today was not the worst day within the recent tracking window for delays in terms of airport count or programme totals.
All data is sourced from the FAA National Airspace System status feed,
tracked and aggregated by travelandtournews.com.
Methodology. travelandtournews.com samples the FAA’s National Airspace System status feed every 20 minutes throughout the US operating day and aggregates the result. This report is built from 43 samples taken between 00:00 and 22:20 UTC on 2026-10-27. Durations are the observed window between the first and last sample in which a programme was in force, so a programme’s true length may be slightly longer than shown. Ground stops, ground delay programmes, airport closures and general delays are all published by the FAA in real time; the daily aggregation is ours.