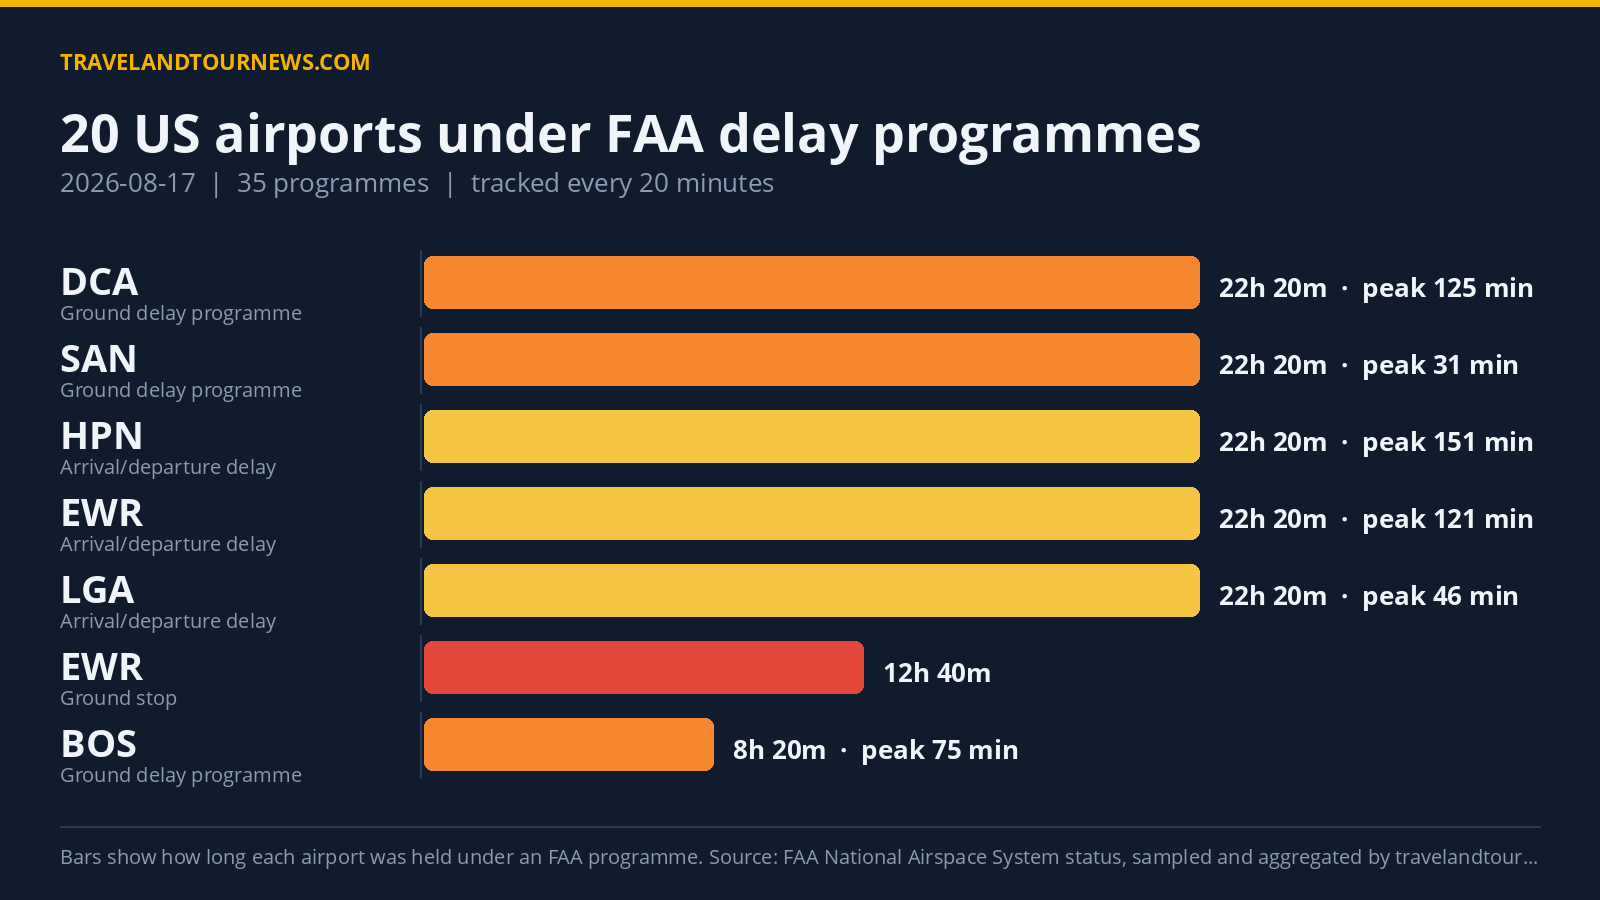

On August 17, 2026, the FAA imposed delay programmes at 20 airports across the United States, totaling 35 separate programmes. Newark Liberty International Airport (EWR) was the worst-hit location, experiencing a peak maximum delay of 1,310 minutes amid thunderstorms and high airspace volume.
Airports and Duration of Delay Programs Across the U.S.
Among the 20 airports affected were major hubs such as Newark (EWR), Ronald Reagan Washington National (DCA), LaGuardia (LGA), Chicago O’Hare (ORD), and Boston Logan (BOS). The FAA’s delay programs included 7 Ground Stop Programs, which hold departures bound for an airport on the ground at their origin, 12 Ground Delay Programs, which meter arrivals by assigning later departure times, and 16 General Arrival/Departure Delay Info updates.
Ground Stop Programs lasted as long as 12 hours and 40 minutes at Newark (EWR), from midnight to 12:40 UTC, attributable to thunderstorms and high airspace volume. Other airports with Ground Stops primarily
faced thunderstorms and low ceilings, but with much shorter durations mostly under two hours.
Ground Delay Programs extended up to 22 hours and 20 minutes at Ronald Reagan Washington National (DCA) and San Diego International (SAN). Peak average delays in these ground delays varied widely, with DCA seeing an average peak delay of 125 minutes and ORD experiencing a maximum peak delay of 1,310 minutes due to an air show causing congestion.
| Airport | FAA programme | Cause | Peak average delay | In force (UTC) |
|---|---|---|---|---|
| Newark Liberty International (EWR) | Ground Stop Programs | thunderstorms; airspace volume | – | 00:00 to 12:40 (12 hours 40 minutes) |
| Ronald Reagan Washington National (DCA) | Ground Stop Programs | thunderstorms | – | 00:00 to 01:20 (1 hour 20 minutes) |
| Baltimore/Washington International (BWI) | Ground Stop Programs | thunderstorms | – | 00:00 to 00:20 (20 minutes) |
| Washington Dulles International (IAD) | Ground Stop Programs | thunderstorms | – | 00:00 to 00:20 (20 minutes) |
| Philadelphia International (PHL) | Ground Stop Programs | low ceilings | – | 00:00 to 00:20 (20 minutes) |
| Denver International (DEN) | Ground Stop Programs | thunderstorms | – | 01:00 to 01:00 (20 minutes) |
| LaGuardia (LGA) | Ground Stop Programs | thunderstorms | – | 20:20 to 20:40 (20 minutes) |
| LaGuardia (LGA) | Ground Delay Programs | thunderstorms | 128 min | 00:00 to 01:20 (1 hour 20 minutes) |
| John F. Kennedy International (JFK) | Ground Delay Programs | thunderstorms | 127 min | 00:00 to 01:20 (1 hour 20 minutes) |
| Ronald Reagan Washington National (DCA) | Ground Delay Programs | thunderstorms; other | 125 min | 00:00 to 22:20 (22 hours 20 minutes) |
| Chicago O’Hare International (ORD) | Ground Delay Programs | air show | 113 min | 00:00 to 03:40 (3 hours 40 minutes) |
| Philadelphia International (PHL) | Ground Delay Programs | low ceilings | 96 min | 00:00 to 01:20 (1 hour 20 minutes) |
| YYZ | Ground Delay Programs | other | 80 min | 20:40 to 22:20 (1 hour 40 minutes) |
| Boston Logan International (BOS) | Ground Delay Programs | low ceilings | 75 min | 14:00 to 22:20 (8 hours 20 minutes) |
Delay Causes by Frequency and Impact
The FAA cited several primary causes for delays. Weather-driven issues dominated, with “TM Initiatives:SWAP:WX” referenced 68 times – these are traffic management initiatives related to weather swaps and
flow management. Low ceilings were listed 57 times, and thunderstorms 49 times, making weather the predominant factor behind delay programs.
Airport volume accounted for 38 programs, particularly influencing long-duration ground delays such as at San Diego International. Compacted demand, classified as “VOL:Compacted Demand,” contributed to 24 programs, reflecting bursts of heavy air traffic demand compressed into short periods.
Comparison With Previous Day and Weekly Average
The 20 airports affected on this date represent a slight increase from yesterday’s 15 airports under FAA delay programs. The total of 35 programs today also increased by 5 from 27 programs recorded the previous day. These figures surpass the recent weekly
average of approximately 18.1 airports affected but do not constitute the worst delay levels within the tracking window.
FAA data tracked by travelandtournews.com summarizes that while today’s volume and impact of delay programs were elevated compared to yesterday and average weekly levels, weather and volume remain ongoing contributors without a record-breaking surge.
Methodology. travelandtournews.com samples the FAA’s National Airspace System status feed every 20 minutes throughout the US operating day and aggregates the result. This report is built from 68 samples taken between 00:00 and 22:20 UTC on 2026-08-17. Durations are the observed window between the first and last sample
in which a programme was in force, so a programme’s true length may be slightly longer than shown. Ground stops, ground delay programmes, airport closures and general delays are all published by the FAA in real time; the daily aggregation is ours.